In general if you want to measure something very small, you need a very large microscope; if you want to measure the nuclear strong force, the force that holds the nuclei of an atom together, you need a very large microscope. One such microscope is the Gamma Ray Infrastructure For Fundamental Investigations of Nuclei (GRIFFIN) located at TRIUMF in Vancouver, British Columbia, Canada. GRIFFIN uses an array of detectors to measure radiation emitted from unstable nuclei – radiation that carries information about the internal structure of the nucleus from which it was emitted. For example, if we measured the angle between two emitted photons, high energy packets of light, we gain information about the angular momentum of the nucleus and how the protons and neutrons are arranged inside of it; In turn providing insight into the strong nuclear force. Since GRIFFIN’s detectors are neither infinitesimally small nor perfectly efficient they require correction factors dependent on both the energy of the photons involved and the physical arrangement of the detector array. These correction factors historically required bespoke simulation campaigns for each energy of interest, but can be generalized by mapping a three dimensional surface where each point requires three distinct Monte-Carlo simulations with 1,000,000,000 events and 400 CPU hours each. Luckily events in Monte-Carlo simulations are stochastically independent meaning mapping the correction factor surface is perfectly suited to large scale distributed computing.
Workflow
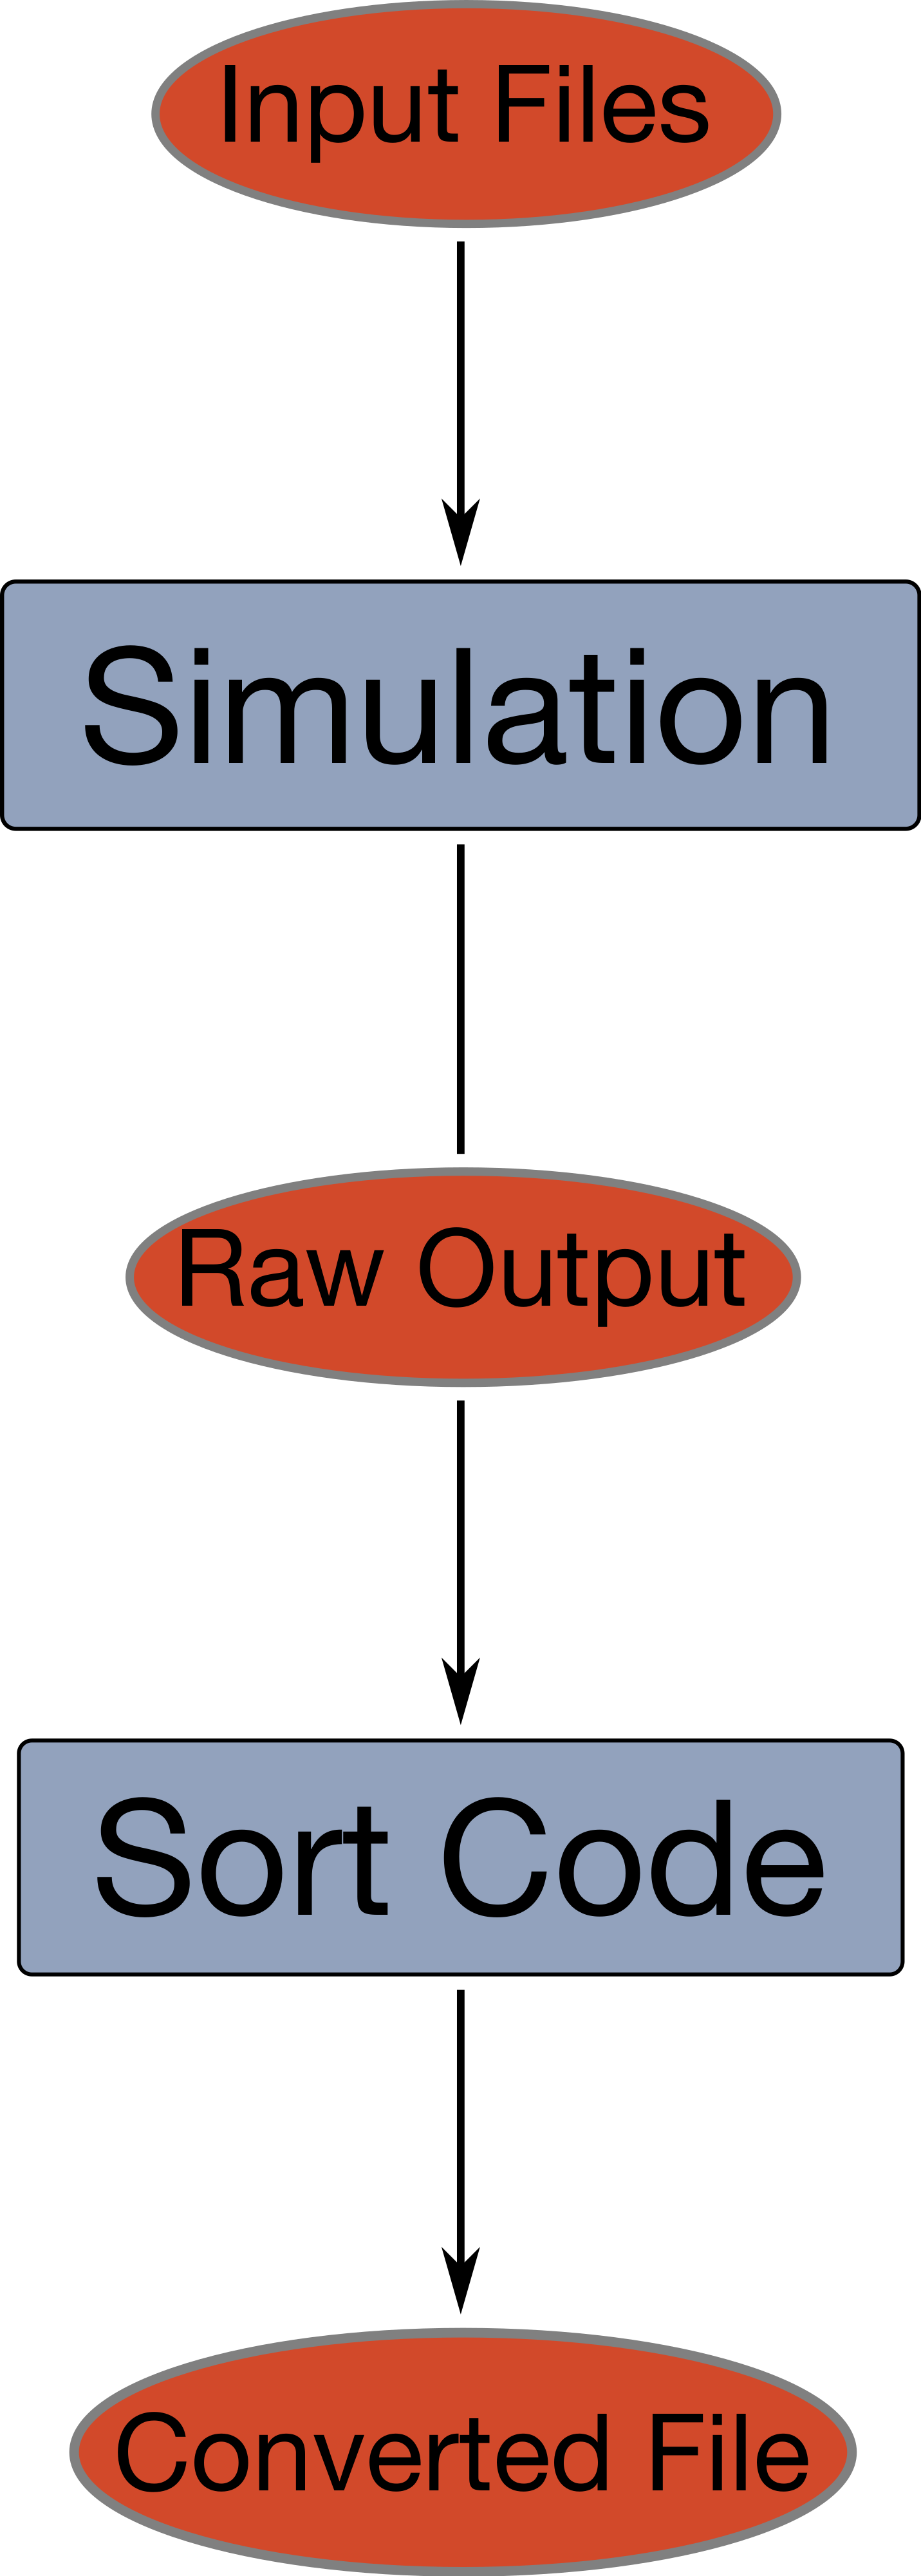
The 1 × 10^9 event simulations were broken up into 1,000 simulations of 1 × 10^6 events in a fan-out style workflow. Each individual branch of the workflow consists of the following steps:
- Input files are passed to the simulation code (GEANT4) inside a docker container run on the execute nodes. This generates a file containing the raw simulation output which is then transferred back to the submit node.
- The simulation output file is passed to another Docker container with a sorting code to transform the raw simulation output into a form usable by downstream analysis code. This converted file is transferred back to the submit node.
- The converted file is transferred to a non-OSG analysis server.
Figure 1 shows a schematic of the basic branch detailed above.Simulation
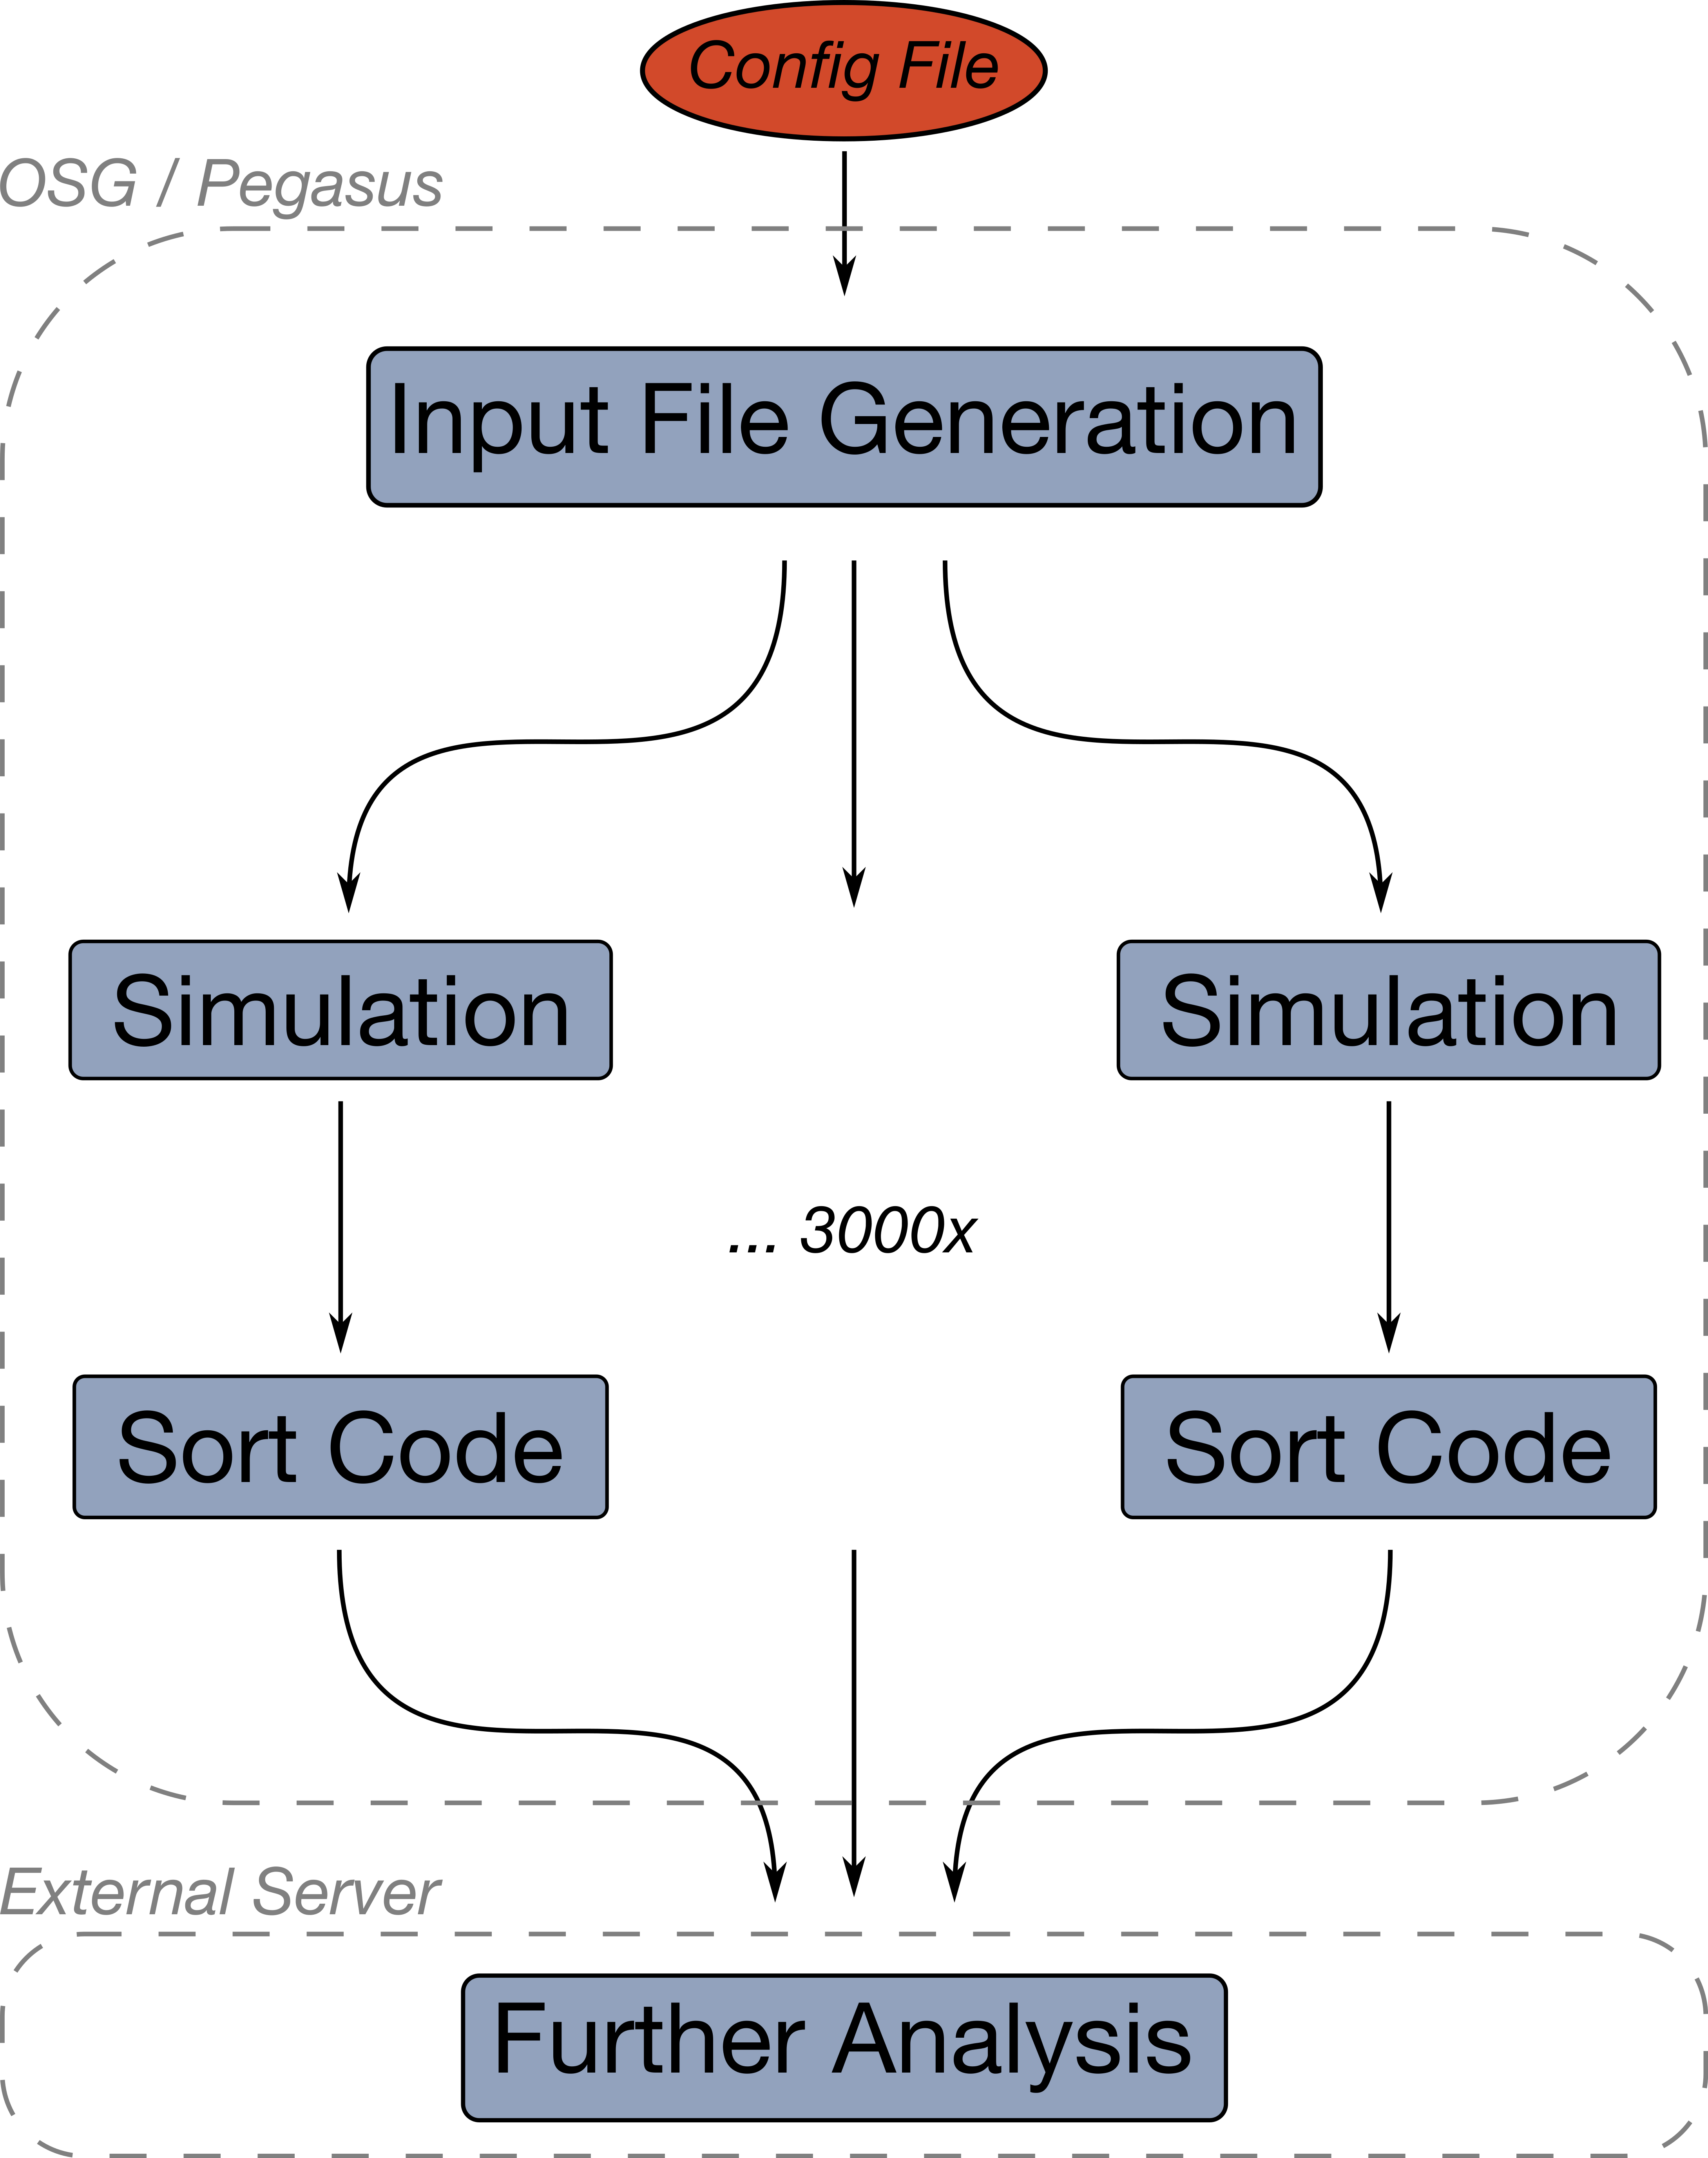
Considering the simplicity of each branch, Pegasus’s greatest contributions to this workflow are the automatic error handling, file transfer, and file cleanup processes. The simulation and sort code occasionally produce bad results and intermittently fail but Pegasus detects these failures and automatically retries until a good output file is produced; Furthermore, the file transfer between nodes and servers happen automatically while intermittent files, such as the raw simulation output, are deleted once they are no longer required. A schematic of the full Pegasus workflow is shown in Figure 2.
Research Impact
As mentioned earlier the correction surface is dependent on not only energy but also the physical geometry of the detector array. A surface had been generated previously for a different arrangement of GRIFFIN detectors than is currently is used and each point on the surface (of which there were 19) took one week of wall time to map. The surface corresponding the current arrangement of detectors requires 41 points and thanks to Pegasus takes only 4 hours of wall time! This is a more than 40 times increase in speed. Furthermore, at the time of writing this blog we have mapped 61 points on the new surface using 135,000 hours on the OSG – over 15 years of time.
Unfortunately the surface has not been correctly fitted, but that doesn’t mean the fitted points haven’t been used. Each point corresponds to a specific energy of interest to the GRIFFIN Collaboration and the correction factors can be extracted directly from the workflow output files. There are multiple manuscripts in preparation using the results of the workflow that will hopefully soon be published.
By far the greatest benefit of Pegasus to this project is the ease of automation and the robustness of the workflow. The simulation code used to map the surface is not unique to surface mapping but is general to GRIFFIN spectrometer with applications ranging from new detector development to modeling exotic radioactive decay modes and how GRIFFIN can measure them. The workflow featured in this post can easily be modified for any future GRIFFIN simulations and will allow future users to run simulations campaign harnessing the power of Pegasus and the OSG.
Workflow Statistics
• Wall time per surface point: 4 hours
• Total points mapped: 61
• Total wall time: 15 years
• Total jobs submitted: 590,000
More Information
Presentation at the 2022 OSG All Hands Meeting:
Scientists: Connor Natzke, Graduate Research Assistant, Colorado School of Mines & TRIUMF