9. Monitoring, Debugging and Statistics
Pegasus comes bundled with useful tools that help users debug workflows and generate useful statistics and plots about their workflow runs. Most of the tools query a runtime workflow database ( usually a sqllite in the workflow submit directory ) populated at runtime by pegasus-monitord. With the exception of pegasus-monitord (see below), all tools take in the submit directory as an argument. Users can invoke the tools listed in this chapter as follows:
$ pegasus-[toolname] <path to the submit directory>
9.1. Workflow Status
As the number of jobs and tasks in workflows increase, the ability to track the progress and quickly debug a workflow becomes more and more important. Pegasus comes with a series of utilities that can be used to monitor and debug workflows both in real-time as well as after execution is already completed.
9.1.1. pegasus-status
To monitor the execution of the workflow run the pegasus-status
command as suggested by the output of the pegasus-run command.
pegasus-status shows the current status of the Condor Q as
pertaining to the master workflow from the workflow directory you are
pointing it to. In a second section, it will show a summary of the state
of all jobs in the workflow and all of its sub-workflows.
The details of pegasus-status are described in its respective
manual page. There are many options to help
you gather the most out of this tool, including a watch-mode to
repeatedly draw information, various modes to add more information, and
legends if you are new to it, or need to present it.
$ pegasus-status /Workflow/dags/directory
STAT  IN_STATE  JOB
Run      05:08  level-3-0
Run      04:32   |-sleep_ID000005
Run      04:27   \_subdax_level-2_ID000004
Run      03:51      |-sleep_ID000003
Run      03:46      \_subdax_level-1_ID000002
Run      03:10         \_sleep_ID000001
Summary: 6 Condor jobs total (R:6)

UNREADY   READY     PRE  QUEUED    POST SUCCESS FAILURE %DONE
      0       0       0       6       0       3       0  33.3
Summary: 3 DAGs total (Running:3)
Without the -l option, only a summary of the workflow statistics
is shown under the current queue status. However, with the -l
option, it will show each sub-workflow separately:
$ pegasus-status -l /Workflow/dags/directory
STAT  IN_STATE  JOB
Run      07:01  level-3-0
Run      06:25   |-sleep_ID000005
Run      06:20   \_subdax_level-2_ID000004
Run      05:44      |-sleep_ID000003
Run      05:39      \_subdax_level-1_ID000002
Run      05:03         \_sleep_ID000001
Summary: 6 Condor jobs total (R:6)

UNRDY READY   PRE  IN_Q  POST  DONE  FAIL %DONE STATE   DAGNAME
    0     0     0     1     0     1     0  50.0 Running level-2_ID000004/level-1_ID000002/level-1-0.dag
    0     0     0     2     0     1     0  33.3 Running level-2_ID000004/level-2-0.dag
    0     0     0     3     0     1     0  25.0 Running *level-3-0.dag
    0     0     0     6     0     3     0  33.3         TOTALS (9 jobs)
Summary: 3 DAGs total (Running:3)
The following output shows a successful workflow of workflow summary after it has finished.
$ pegasus-status work/2011080514
(no matching jobs found in Condor Q)
UNREADY   READY     PRE  QUEUED    POST SUCCESS FAILURE %DONE
      0       0       0       0       0   7,137       0 100.0
Summary: 44 DAGs total (Success:44)
Warning
For large workflows with many jobs, please note that
pegasus-statuswill take time to compile tthe state from all workflow files. This typically affects the initial run, and sub-sequent runs are faster due to the file system’s buffer cache. However, on a low-RAM machine, thrashing is a possibility.
The following output shows a failed workflow after no more jobs from it exist. Please note how no active jobs are shown, and the failure status of the total workflow.
$ pegasus-status work/submit
(no matching jobs found in Condor Q)
UNREADY   READY     PRE  QUEUED    POST SUCCESS FAILURE %DONE
     20       0       0       0       0       0       2   0.0
Summary: 1 DAG total (Failure:1)
9.1.2. pegasus-analyzer
Pegasus-analyzer is a command-line utility for parsing several files in the workflow directory and summarizing useful information to the user. It should be used after the workflow has already finished execution. pegasus-analyzer quickly goes through the jobstate.log file, and isolates jobs that did not complete successfully. It then parses their submit, and kickstart output files, printing detailed information for helping the user debug what happened to their workflow.
The simplest way to invoke pegasus-analyzer is to simply give it a workflow run directory, like in the example below:
$ pegasus-analyzer  /home/user/run0004
pegasus-analyzer: initializing...

************************************Summary*************************************

 Total jobs         :     26 (100.00%)
 # jobs succeeded   :     25 (96.15%)
 # jobs failed      :      1 (3.84%)
 # jobs held        :      1 (3.84%)
 # jobs unsubmitted :      0 (0.00%)

*******************************Held jobs' details*******************************

================================sleep_ID0000001=================================

       submit file            : sleep_ID0000001.sub
       last_job_instance_id   : 7
       reason                 :  Error from slot1@corbusier.isi.edu:
                                 STARTER at 128.9.64.188 failed to
                                 send file(s) to
                                 <128.9.64.188:62639>: error reading from
                                 /opt/condor/8.4.8/local.corbusier/execute/dir_76205/f.out:
                                 (errno 2) No such file or directory;
                                SHADOW failed to receive file(s) from <128.9.64.188:62653>

******************************Failed jobs' details******************************

============================register_viz_glidein_7_0============================

 last state: POST_SCRIPT_FAILURE
       site: local
submit file: /home/user/run0004/register_viz_glidein_7_0.sub
output file: /home/user/run0004/register_viz_glidein_7_0.out.002
 error file: /home/user/run0004/register_viz_glidein_7_0.err.002

-------------------------------Task #1 - Summary--------------------------------

site        : local
executable  : /lfs1/software/install/pegasus/default/bin/rc-client
arguments   : -Dpegasus.user.properties=/lfs1/work/pegasus/run0004/pegasus.15181.properties \
-Dpegasus.catalog.replica.url=rlsn://smarty.isi.edu --insert register_viz_glidein_7_0.in
exitcode    : 1
working dir : /lfs1/work/pegasus/run0004

---------Task #1 - pegasus::rc-client - pegasus::rc-client:1.0 - stdout---------

2009-02-20 16:25:13.467 ERROR [root] You need to specify the pegasus.catalog.replica property
2009-02-20 16:25:13.468 WARN  [root] non-zero exit-code 1
In the case above, pegasus-analyzer’s output contains a brief summary section, showing how many jobs have succeeded and how many have failed. If there are any held jobs, pegasus-analyzer will report the name of the job that was held, and the reason why, as determined from the dagman.out file for the workflow. The last_job_instance_id is the database id for the job in the job instance table of the monitoring database. After that, pegasus-analyzer will print information about each job that failed, showing its last known state, along with the location of its submit, output, and error files. pegasus-analyzer will also display any stdout and stderr from the job, as recorded in its kickstart record. Please consult pegasus-analyzer’s man page for more examples and a detailed description of its various command-line options.
Note
Starting with 4.0 release, by default pegasus analyzer queries the database to debug the workflow. If you want it to use files in the submit directory , use the –files option.
9.1.3. pegasus-remove
If you want to abort your workflow for any reason you can use the pegasus-remove command listed in the output of pegasus-run invocation or by specifying the Dag directory for the workflow you want to terminate.
$ pegasus-remove /PATH/To/WORKFLOW DIRECTORY
9.1.4. Resubmitting failed workflows
Pegasus will remove the DAGMan and all the jobs related to the DAGMan from the condor queue. A rescue DAG will be generated in case you want to resubmit the same workflow and continue execution from where it last stopped. A rescue DAG only skips jobs that have completely finished. It does not continue a partially running job unless the executable supports checkpointing.
To resubmit an aborted or failed workflow with the same submit files and rescue DAG just rerun the pegasus-run command
$ pegasus-run /Path/To/Workflow/Directory
9.2. Plotting and Statistics
Pegasus plotting and statistics tools queries the Stampede database created by pegasus-monitord for generating the output.The stampede scheme can be found here.
The statistics and plotting tools use the following terminology for defining tasks, jobs etc. Pegasus takes in a DAX which is composed of tasks. Pegasus plans it into a HTCondor DAG / Executable workflow that consists of Jobs. In case of Clustering, multiple tasks in the DAX can be captured into a single job in the Executable workflow. When DAGMan executes a job, a job instance is populated . Job instances capture information as seen by DAGMan. In case DAGMan retires a job on detecting a failure , a new job instance is populated. When DAGMan finds a job instance has finished , an invocation is associated with job instance. In case of clustered job, multiple invocations will be associated with a single job instance. If a Pre script or Post Script is associated with a job instance, then invocations are populated in the database for the corresponding job instance.
9.2.1. pegasus-statistics
Pegasus statistics can compute statistics over one or more than one workflow runs.
Command to generate statistics over a single run is as shown below.
$ pegasus-statistics /scratch/grid-setup/run0001/ -s all

#
# Pegasus Workflow Management System - http://pegasus.isi.edu
#
# Workflow summary:
#   Summary of the workflow execution. It shows total
#   tasks/jobs/sub workflows run, how many succeeded/failed etc.
#   In case of hierarchical workflow the calculation shows the
#   statistics across all the sub workflows.It shows the following
#   statistics about tasks, jobs and sub workflows.
#     * Succeeded - total count of succeeded tasks/jobs/sub workflows.
#     * Failed - total count of failed tasks/jobs/sub workflows.
#     * Incomplete - total count of tasks/jobs/sub workflows that are
#       not in succeeded or failed state. This includes all the jobs
#       that are not submitted, submitted but not completed etc. This
#       is calculated as  difference between 'total' count and sum of
#       'succeeded' and 'failed' count.
#     * Total - total count of tasks/jobs/sub workflows.
#     * Retries - total retry count of tasks/jobs/sub workflows.
#     * Total+Retries - total count of tasks/jobs/sub workflows executed
#       during workflow run. This is the cumulative of retries,
#       succeeded and failed count.
# Workflow wall time:
#   The wall time from the start of the workflow execution to the end as
#   reported by the DAGMAN.In case of rescue dag the value is the
#   cumulative of all retries.
# Cumulative job wall time:
#   The sum of the wall time of all jobs as reported by kickstart.
#   In case of job retries the value is the cumulative of all retries.
#   For workflows having sub workflow jobs (i.e SUBDAG and SUBDAX jobs),
#   the wall time value includes jobs from the sub workflows as well.
# Cumulative job wall time as seen from submit side:
#   The sum of the wall time of all jobs as reported by DAGMan.
#   This is similar to the regular cumulative job wall time, but includes
#   job management overhead and delays. In case of job retries the value
#   is the cumulative of all retries. For workflows having sub workflow
#   jobs (i.e SUBDAG and SUBDAX jobs), the wall time value includes jobs
#   from the sub workflows as well.
# Cumulative job badput wall time:
#   The sum of the wall time of all failed jobs as reported by kickstart.
#   In case of job retries the value is the cumulative of all retries.
#   For workflows having sub workflow jobs (i.e SUBDAG and SUBDAX jobs),
#   the wall time value includes jobs from the sub workflows as well.
# Cumulative job badput wall time as seen from submit side:
#   The sum of the wall time of all failed jobs as reported by DAGMan.
#   This is similar to the regular cumulative job badput wall time, but includes
#   job management overhead and delays. In case of job retries the value
#   is the cumulative of all retries. For workflows having sub workflow
#   jobs (i.e SUBDAG and SUBDAX jobs), the wall time value includes jobs
#   from the sub workflows as well.
------------------------------------------------------------------------------
Type           Succeeded Failed  Incomplete  Total     Retries   Total+Retries
Tasks          5         0       0           5         0         5
Jobs           10        0       0           10        0         10
Sub-Workflows  0         0       0           0         0         0
------------------------------------------------------------------------------

Workflow wall time                                       : 1 min, 56 secs
Cumulative job wall time                                 : 12.41 secs
Cumulative job wall time as seen from submit side        : 21.0 secs
Cumulative job badput wall time                          : 0.0 sec
Cumulative job badput wall time as seen from submit side : 0.0 sec

# Integrity Metrics
# Number of files for which checksums were compared/computed along with total time spent doing it.
9 files checksums compared with total duration of 0.76 secs
9 files checksums generated with total duration of 0.04 secs

# Integrity Errors
# Total:
#       Total number of integrity errors encountered across all job executions(including retries) of a workflow.
# Failures:
#       Number of failed jobs where the last job instance had integrity errors.
Failures: 0 job failures had integrity errors

Summary                       : split/submit/mayani/pegasus/split/run0001/statistics/summary.txt
Workflow execution statistics : split/submit/mayani/pegasus/split/run0001/statistics/workflow.txt
Job instance statistics       : split/submit/mayani/pegasus/split/run0001/statistics/jobs.txt
Transformation statistics     : split/submit/mayani/pegasus/split/run0001/statistics/breakdown.txt
Integrity statistics          : split/submit/mayani/pegasus/split/run0001/statistics/integrity.txt
Time statistics               : split/submit/mayani/pegasus/split/run0001/statistics/time.txt
By default the output gets generated to a statistics folder inside the submit directory. The output that is generated by pegasus-statistics is based on the value set for command line option ‘s’(statistics_level). In the sample run the command line option ‘s’ is set to ‘all’ to generate all the statistics information for the workflow run. Please consult the pegasus-statistics man page to find a detailed description of various command line options.
Note
In case of hierarchal workflows, the metrics that are displayed on stdout take into account all the jobs/tasks/sub workflows that make up the workflow by recursively iterating through each sub workflow.
Command to generate statistics over all workflow runs populated in a single database is as shown below.
$ pegasus-statistics -Dpegasus.monitord.output='mysql://s_user:s_user123@127.0.0.1:3306/stampede' -o /scratch/workflow_1_2/statistics -s all --multiple-wf


#
# Pegasus Workflow Management System - http://pegasus.isi.edu
#
# Workflow summary:
#   Summary of the workflow execution. It shows total
#   tasks/jobs/sub workflows run, how many succeeded/failed etc.
#   In case of hierarchical workflow the calculation shows the
#   statistics across all the sub workflows.It shows the following
#   statistics about tasks, jobs and sub workflows.
#     * Succeeded - total count of succeeded tasks/jobs/sub workflows.
#     * Failed - total count of failed tasks/jobs/sub workflows.
#     * Incomplete - total count of tasks/jobs/sub workflows that are
#       not in succeeded or failed state. This includes all the jobs
#       that are not submitted, submitted but not completed etc. This
#       is calculated as  difference between 'total' count and sum of
#       'succeeded' and 'failed' count.
#     * Total - total count of tasks/jobs/sub workflows.
#     * Retries - total retry count of tasks/jobs/sub workflows.
#     * Total+Retries - total count of tasks/jobs/sub workflows executed
#       during workflow run. This is the cumulative of retries,
#       succeeded and failed count.
# Workflow wall time:
#   The wall time from the start of the workflow execution to the end as
#   reported by the DAGMAN.In case of rescue dag the value is the
#   cumulative of all retries.
# Workflow cumulative job wall time:
#   The sum of the wall time of all jobs as reported by kickstart.
#   In case of job retries the value is the cumulative of all retries.
#   For workflows having sub workflow jobs (i.e SUBDAG and SUBDAX jobs),
#   the wall time value includes jobs from the sub workflows as well.
# Cumulative job wall time as seen from submit side:
#   The sum of the wall time of all jobs as reported by DAGMan.
#   This is similar to the regular cumulative job wall time, but includes
#   job management overhead and delays. In case of job retries the value
#   is the cumulative of all retries. For workflows having sub workflow
#   jobs (i.e SUBDAG and SUBDAX jobs), the wall time value includes jobs
#   from the sub workflows as well.
# Workflow cumulative job badput wall time:
#   The sum of the wall time of all failed jobs as reported by kickstart.
#   In case of job retries the value is the cumulative of all retries.
#   For workflows having sub workflow jobs (i.e SUBDAG and SUBDAX jobs),
#   the wall time value includes jobs from the sub workflows as well.
# Cumulative job badput wall time as seen from submit side:
#   The sum of the wall time of all failed jobs as reported by DAGMan.
#   This is similar to the regular cumulative job badput wall time, but includes
#   job management overhead and delays. In case of job retries the value
#   is the cumulative of all retries. For workflows having sub workflow
#   jobs (i.e SUBDAG and SUBDAX jobs), the wall time value includes jobs
#   from the sub workflows as well.

------------------------------------------------------------------------------
Type           Succeeded Failed  Incomplete  Total     Retries   Total+Retries
Tasks          8         0       0           8         0         8
Jobs           34        0       0           34        0         34
Sub-Workflows  0         0       0           0         0         0
------------------------------------------------------------------------------

Workflow cumulative job wall time                        : 8 mins, 5 secs
Cumulative job wall time as seen from submit side        : 8 mins, 35 secs
Workflow cumulative job badput wall time                 : 0
Cumulative job badput wall time as seen from submit side : 0
Note
When computing statistics over multiple workflows, please note,
All workflow run information should be populated in a single STAMPEDE database.
The –output argument must be specified.
Job statistics information is not computed.
Workflow wall time information is not computed.
Pegasus statistics can also compute statistics over a few specified workflow runs, by specifying the either the submit directories, or the workflow UUIDs.
pegasus-statistics -Dpegasus.monitord.output='<DB_URL>' -o <OUTPUT_DIR> <SUBMIT_DIR_1> <SUBMIT_DIR_2> .. <SUBMIT_DIR_n>

OR

pegasus-statistics -Dpegasus.monitord.output='<DB_URL>' -o <OUTPUT_DIR> --isuuid <UUID_1> <UUID_2> .. <UUID_n>
pegasus-statistics generates the following statistics files based on the command line options set.
9.2.1.1. Summary Statistics File [summary.txt]
The summary statistics are listed on the stdout by default, and can be written out to a file by providing the -s summary option.
Workflow summary - Summary of the workflow execution. In case of hierarchical workflow the calculation shows the statistics across all the sub workflows.It shows the following statistics about tasks, jobs and sub workflows.
Succeeded - total count of succeeded tasks/jobs/sub workflows.
Failed - total count of failed tasks/jobs/sub workflows.
Incomplete - total count of tasks/jobs/sub workflows that are not in succeeded or failed state. This includes all the jobs that are not submitted, submitted but not completed etc. This is calculated as difference between ‘total’ count and sum of ‘succeeded’ and ‘failed’ count.
Total - total count of tasks/jobs/sub workflows.
Retries - total retry count of tasks/jobs/sub workflows.
Total Run - total count of tasks/jobs/sub workflows executed during workflow run. This is the cumulative of total retries, succeeded and failed count.
Workflow wall time - The wall time from the start of the workflow execution to the end as reported by the DAGMAN.In case of rescue dag the value is the cumulative of all retries.
Workflow cummulate job wall time - The sum of the wall time of all jobs as reported by kickstart. In case of job retries the value is the cumulative of all retries. For workflows having sub workflow jobs (i.e SUBDAG and SUBDAX jobs), the wall time value includes jobs from the sub workflows as well. This value is multiplied by the multiplier_factor in the job instance table.
Cumulative job wall time as seen from submit side - The sum of the wall time of all jobs as reported by DAGMan. This is similar to the regular cumulative job wall time, but includes job management overhead and delays. In case of job retries the value is the cumulative of all retries. For workflows having sub workflow jobs (i.e SUBDAG and SUBDAX jobs), the wall time value includes jobs from the sub workflows. This value is multiplied by the multiplier_factor in the job instance table.
Integrity Metrics
Number of files for which the checksum was compared against a previously computed or provided checksum and total duration in seconds spent in doing it.
Number of files for which the checksum was generated during workflow execution and total duration in seconds spent in doing it.
9.2.1.2. Workflow statistics file per workflow [workflow.txt]
Workflow statistics file per workflow contains the following information about each workflow run. In case of hierarchal workflows, the file contains a table for each sub workflow. The file also contains a ‘Total’ table at the bottom which is the cumulative of all the individual statistics details.
A sample table is shown below. It shows the following statistics about tasks, jobs and sub workflows.
Workflow retries - number of times a workflow was retried.
Succeeded - total count of succeeded tasks/jobs/sub workflows.
Failed - total count of failed tasks/jobs/sub workflows.
Incomplete - total count of tasks/jobs/sub workflows that are not in succeeded or failed state. This includes all the jobs that are not submitted, submitted but not completed etc. This is calculated as difference between ‘total’ count and sum of ‘succeeded’ and ‘failed’ count.
Total - total count of tasks/jobs/sub workflows.
Retries - total retry count of tasks/jobs/sub workflows.
Total Run - total count of tasks/jobs/sub workflows executed during workflow run. This is the cumulative of total retries, succeeded and failed count.
# |
Type |
Succeeded |
Failed |
Incomplete |
Total |
Retries |
Total Run |
Workflow Retries |
|---|---|---|---|---|---|---|---|---|
2a6df11b-9972-4ba0-b4ba-4fd39c357af4 |
0 |
|||||||
Tasks |
4 |
0 |
0 |
4 |
0 |
4 |
||
Jobs |
13 |
0 |
0 |
13 |
0 |
13 |
||
Sub Workflows |
0 |
0 |
0 |
0 |
0 |
0 |
9.2.1.3. Job statistics file per workflow [jobs.txt]
Job statistics file per workflow contains the following details about the job instances in each workflow. A sample file is shown below.
Job - the name of the job instance
Try - the number representing the job instance run count.
Site - the site where the job instance ran.
Kickstart(sec.) - the actual duration of the job instance in seconds on the remote compute node.
Mult - multiplier factor from the job instance table for the job.
Kickstart_Mult - value of the Kickstart column multiplied by Mult.
CPU-Time - remote CPU time computed as the stime + utime (when Kickstart is not used, this is empty).
Post(sec.) - the postscript time as reported by DAGMan.
CondorQTime(sec.) - the time between submission by DAGMan and the remote Grid submission. It is an estimate of the time spent in the condor q on the submit node .
Resource(sec.) - the time between the remote Grid submission and start of remote execution . It is an estimate of the time job instance spent in the remote queue .
Runtime(sec.) - the time spent on the resource as seen by Condor DAGMan . Is always >=kickstart .
Seqexec(sec.) - the time taken for the completion of a clustered job instance .
Seqexec-Delay(sec.) - the time difference between the time for the completion of a clustered job instance and sum of all the individual tasks kickstart time .
Job |
Try |
Site |
Kickstart |
Mult |
Kickstart_Mult |
CPU-Time |
Post |
CondorQTime |
Resource |
Runtime |
Seqexec |
Seqexec-Delay |
|---|---|---|---|---|---|---|---|---|---|---|---|---|
analyze_ID0000004 |
1 |
local |
60.002 |
1 |
60.002 |
59.843 |
5.0 |
0.0 |
62.0 |
|||
create_dir_diamond_0_local |
1 |
local |
0.027 |
1 |
0.027 |
0.003 |
5.0 |
5.0 |
0.0 |
|||
findrange_ID0000002 |
1 |
local |
60.001 |
10 |
600.01 |
59.921 |
5.0 |
0.0 |
60.0 |
|||
findrange_ID0000003 |
1 |
local |
60.002 |
10 |
600.02 |
59.912 |
5.0 |
10.0 |
61.0 |
|||
preprocess_ID0000001 |
1 |
local |
60.002 |
1 |
60.002 |
59.898 |
5.0 |
5.0 |
60.0 |
|||
register_local_1_0 |
1 |
local |
0.459 |
1 |
0.459 |
0.432 |
6.0 |
5.0 |
0.0 |
|||
register_local_1_1 |
1 |
local |
0.338 |
1 |
0.338 |
0.331 |
5.0 |
5.0 |
0.0 |
|||
register_local_2_0 |
1 |
local |
0.348 |
1 |
0.348 |
0.342 |
5.0 |
5.0 |
0.0 |
|||
stage_in_local_local_0 |
1 |
local |
0.39 |
1 |
0.39 |
0.032 |
5.0 |
5.0 |
0.0 |
|||
stage_out_local_local_0_0 |
1 |
local |
0.165 |
1 |
0.165 |
0.108 |
5.0 |
10.0 |
0.0 |
|||
stage_out_local_local_1_0 |
1 |
local |
0.147 |
1 |
0.147 |
0.098 |
7.0 |
5.0 |
0.0 |
|||
stage_out_local_local_1_1 |
1 |
local |
0.139 |
1 |
0.139 |
0.089 |
5.0 |
6.0 |
0.0 |
|||
stage_out_local_local_2_0 |
1 |
local |
0.145 |
1 |
0.145 |
0.101 |
5.0 |
5.0 |
0.0 |
9.2.1.4. Transformation statistics file per workflow [breakdown.txt]
Transformation statistics file per workflow contains information about the invocations in each workflow grouped by transformation name. A sample file is shown below.
Transformation - name of the transformation.
Type - Successful or failed.
Count - the number of times invocations with a given transformation name was executed.
Min (runtime) - the minimum runtime value of invocations with a given logical transformation name times the multipler_factor.
Max (runtime) - the minimum runtime value of invocations with a given logical transformation name times the multiplier_factor.
Mean (runtime) - the mean of the invocation runtimes with a given logical transformation name times the multiplier_factor.
Total (runtime) - the cumulative of runtime value of invocations with a given logical transformation name times the multiplier_factor.
Min (memory) - the minimum of the max. resident set size (RSS) value corresponding to the transformation. In MB.
Max (memory) - the maximum of the max. resident set size (RSS) value corresponding to the transformation. In MB.
Mean (memory) - the mean of the max. resident set size (RSS) value corresponding to the transformation. In MB.
Min (avg. cpu) - the minimum of the average cpu utilization value corresponding to the transformation.
Max (avg. cpu) - the maximum of the average cpu utilization value corresponding to the transformation.
Mean (avg. cpu) - the mean of the average cpu utilization value corresponding to the transformation.
The memory values reported are derived from the maxrss values reported by pegasus-kickstart in the invocation records. The average cpu utilization to be computed as (utime+stime)/duration from the values reported by pegasus-kickstart in the invocation record for the main job.
Transformation |
Type |
Count |
Min (runtime) |
Max (runtime) |
Mean (runtime) |
Total (runtime) |
Min (mem) |
Max (mem) |
Mean (mem) |
Min (avg. cpu) |
Max (avg. cpu) |
Mean (avg. cpu) |
|---|---|---|---|---|---|---|---|---|---|---|---|---|
dagman::post |
successful |
13 |
5.0 |
7.0 |
5.231 |
68.0 |
||||||
diamond::analyze |
successful |
1 |
60.002 |
60.002 |
60.002 |
60.002 |
16.547 |
16.762 |
16.654 |
18.24% |
20.58% |
19.41% |
diamond::findrange |
successful |
2 |
600.01 |
600.02 |
600.02 |
1200.03 |
0.73 |
0.758 |
0.74 |
66.67% |
100.0% |
83.33% |
diamond::preprocess |
successful |
1 |
60.002 |
60.002 |
60.002 |
60.002 |
0.742 |
0.742 |
0.742 |
85.71% |
85.71% |
85.71% |
pegasus::dirmanager |
successful |
1 |
0.027 |
0.027 |
0.027 |
0.027 |
16.75 |
16.75 |
16.75 |
12.86% |
12.86% |
12.86% |
pegasus::pegasus-transfer |
successful |
5 |
0.139 |
0.39 |
0.197 |
0.986 |
16.547 |
16.762 |
16.654 |
18.24% |
20.58% |
19.41% |
pegasus::rc-client |
successful |
3 |
0.338 |
0.459 |
0.382 |
1.145 |
6.371 |
6.449 |
6.41 |
39.2% |
86.21% |
62.71% |
9.2.1.5. Time statistics file [time.txt]
Time statistics file contains job instance and invocation statistics information grouped by time and host. The time grouping can be on day/hour. The file contains the following tables Job instance statistics per day/hour, Invocation statistics per day/hour, Job instance statistics by host per day/hour and Invocation by host per day/hour. A sample Invocation statistics by host per day table is shown below.
Job instance statistics per day/hour - the number of job instances run, total runtime sorted by day/hour.
Invocation statistics per day/hour - the number of invocations , total runtime sorted by day/hour.
Job instance statistics by host per day/hour - the number of job instances run, total runtime on each host sorted by day/hour.
Invocation statistics by host per day/hour - the number of invocations , total runtime on each host sorted by day/hour.
Date [YYYY-MM-DD] |
Host |
Count |
Runtime (Sec.) |
|---|---|---|---|
2011-07-15 |
butterfly.isi.edu |
54 |
625.094 |
9.2.1.6. Integrity statistics file per workflow [integrity.txt]
Integrity statistics file contains integrity metrics grouped by file type (input or output) and integrity type (check or compute). A sample table is shown below. It shows the following statistics about integrity checks.
Type - the type of integrity metric. Check means checksum was compared for a file, and compute means a checksum was generated for a file.
File type - the type of file: input or output from a job perspective.
Count - the number of times type, file type integrity check was performed.
Total duration - sum of duration in seconds for the ‘count’ number of records matching the particular type, file-type combo.
# |
Type |
File Type |
Count |
Total Duration |
|---|---|---|---|---|
4555392d-1b37-407c-98d3-60fb86cb9d57 |
||||
check |
input |
5 |
0.164 |
|
check |
output |
5 |
1.456 |
|
compute |
input |
5 |
0.693 |
|
compute |
output |
5 |
0.758 |
9.3. Dashboard
As the number of jobs and tasks in workflows increase, the ability to track the progress and quickly debug a workflow becomes more and more important. The dashboard provides users with a tool to monitor and debug workflows both in real-time as well as after execution is already completed, through a browser.
9.3.1. Workflow Dashboard
Pegasus Workflow Dashboard is bundled with Pegasus. The pegasus-service is developed in Python and uses the Flask framework to implement the web interface.The users can then connect to this server using a browser to monitor/debug workflows.
Note
the workflow dashboard can only monitor workflows which have been executed using Pegasus 4.2.0 and above.
To start the Pegasus Dashboard execute the following command
$ pegasus-service --host 127.0.0.1 --port 5000

SSL is not configured: Using self-signed certificate
2015-04-13 16:14:23,074:Pegasus.service.server:79: WARNING: SSL is not configured: Using self-signed certificate
Service not running as root: Will not be able to switch users
2015-04-13 16:14:23,074:Pegasus.service.server:86: WARNING: Service not running as root: Will not be able to switch users
By default, the server is configured to listen only on localhost/127.0.0.1 on port 5000. A user can view the dashboard on https://localhost:5000/
To make the Pegasus Dashboard listen on all network interfaces OR on a different port, users can pass different values to the –host and/or –port options.
By default, the dashboard server can only monitor workflows run by the current user i.e. the user who is running the pegasus-service.
The Dashboard’s home page lists all workflows, which have been run by the current-user. The home page shows the status of each of the workflow i.e. Running/Successful/Failed/Failing. The home page lists only the top level workflows (Pegasus supports hierarchical workflows i.e. workflows within a workflow). The rows in the table are color coded
Green: indicates workflow finished successfully.
Red: indicates workflow finished with a failure.
Blue: indicates a workflow is currently running.
Gray: indicates a workflow that was archived.
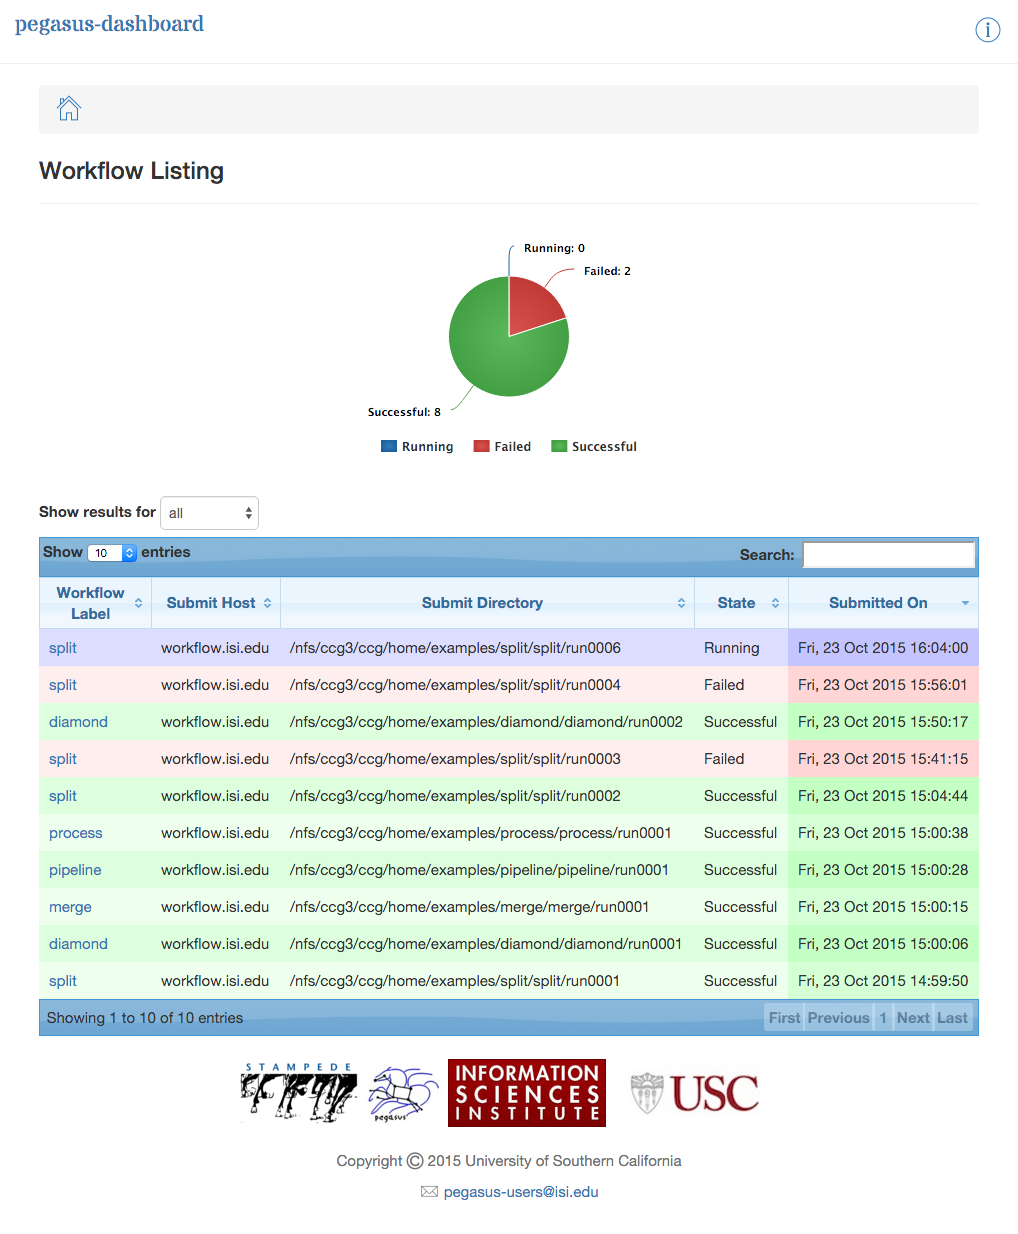
Dashboard Home Page
To view details specific to a workflow, the user can click on corresponding workflow label. The workflow details page lists workflow specific information like workflow label, workflow status, location of the submit directory, files, and metadata associated with the workflow etc. The details page also displays pie charts showing the distribution of jobs based on status.
In addition, the details page displays a tab listing all sub-workflows and their statuses. Additional tabs exist which list information for all running, failed, successful, and failing jobs.
Note
Failing jobs are currently running jobs (visible in Running tab), which have failed in previous attempts to execute them.
The information displayed for a job depends on it’s status. For example, the failed jobs tab displays the job name, exit code, links to available standard output, and standard error contents.
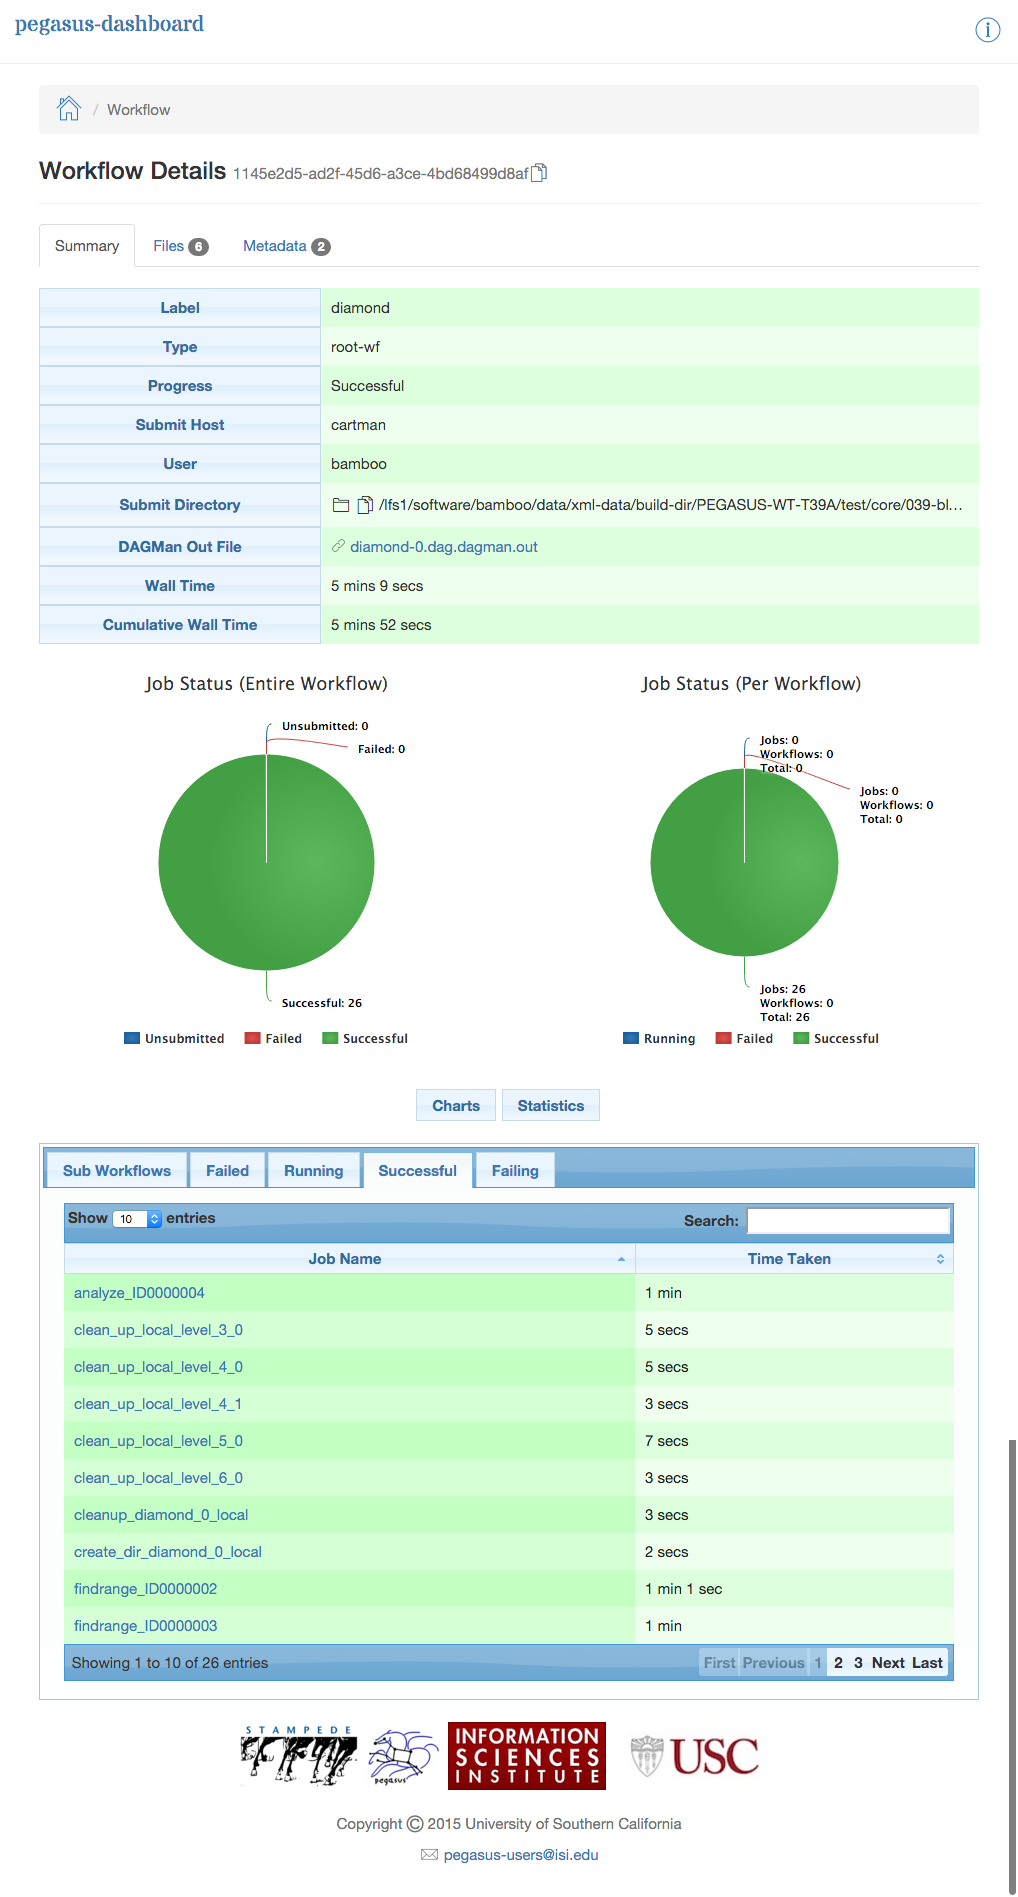
Dashboard Workflow Page
To view details specific to a job the user can click on the corresponding job’s job label. The job details page lists information relevant to a specific job. For example, the page lists information like job name, exit code, run time, etc.
The job instance section of the job details page lists all attempts made to run the job i.e. if a job failed in its first attempt due to transient errors, but ran successfully when retried, the job instance section shows two entries; one for each attempt to run the job.
The job details page also shows tab’s for failed, and successful task invocations (Pegasus allows users to group multiple smaller task’s into a single job i.e. a job may consist of one or more tasks)
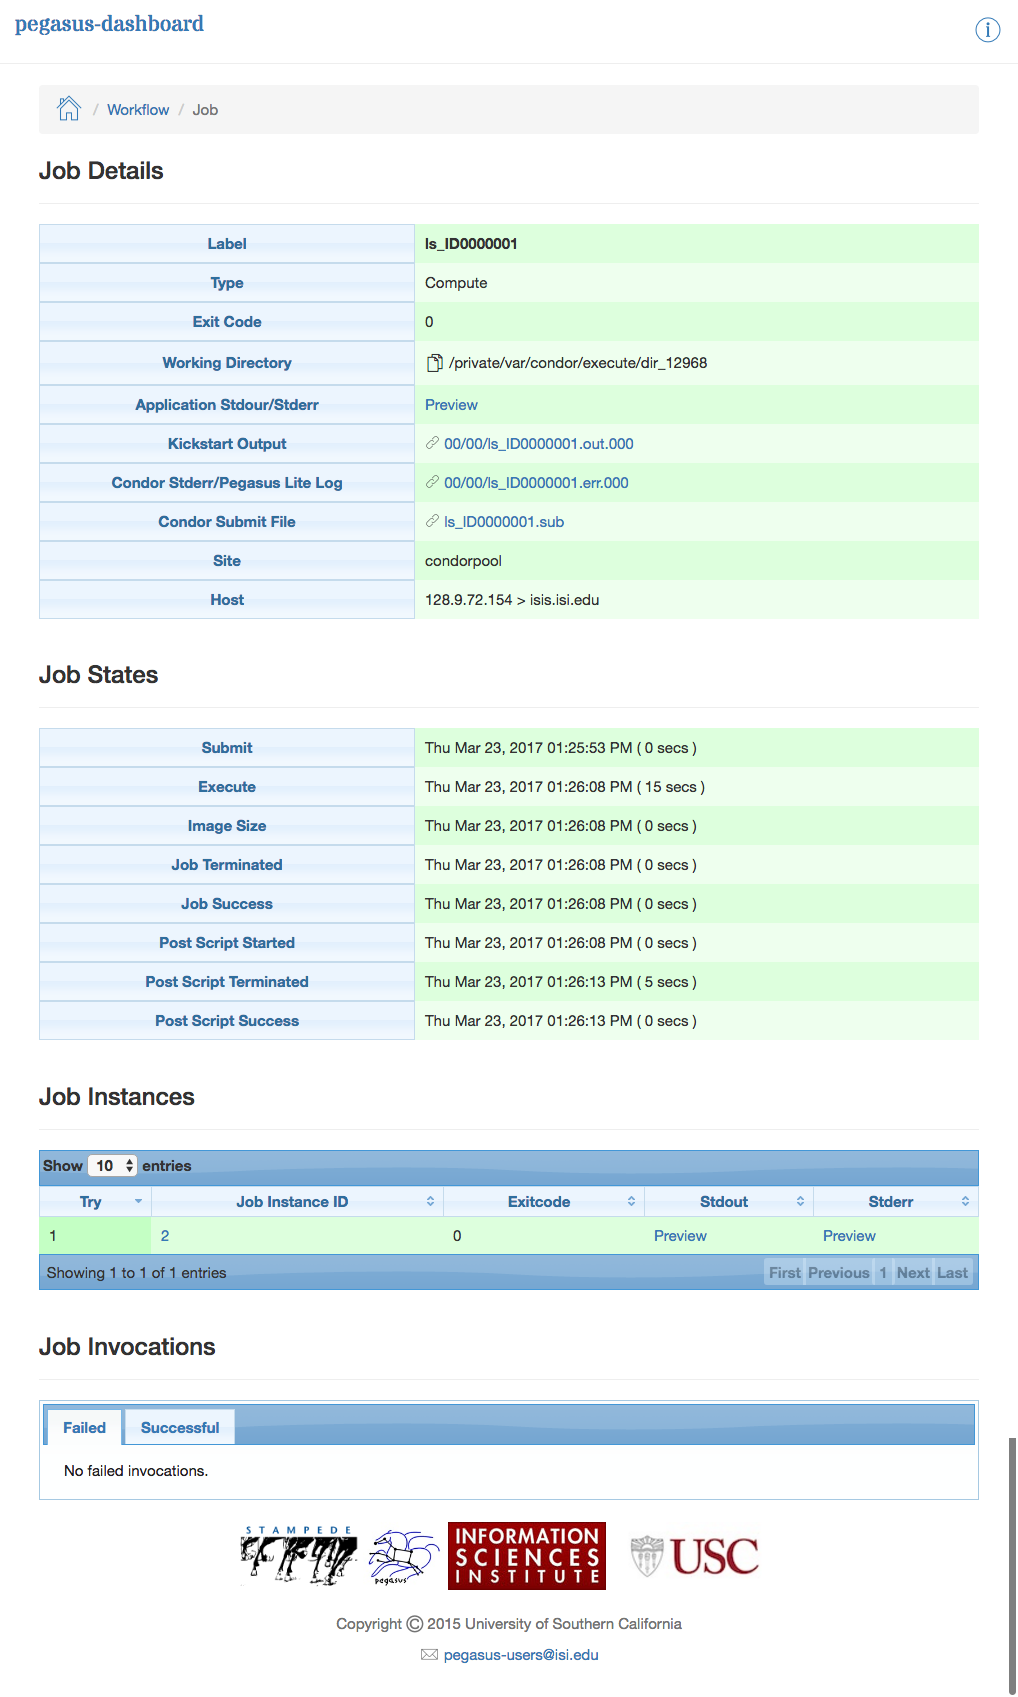
Dashboard Job Description Page
The task invocation details page provides task specific information like task name, exit code, duration, metadata associated with the task, etc. Task details differ from job details, as they are more granular in nature.
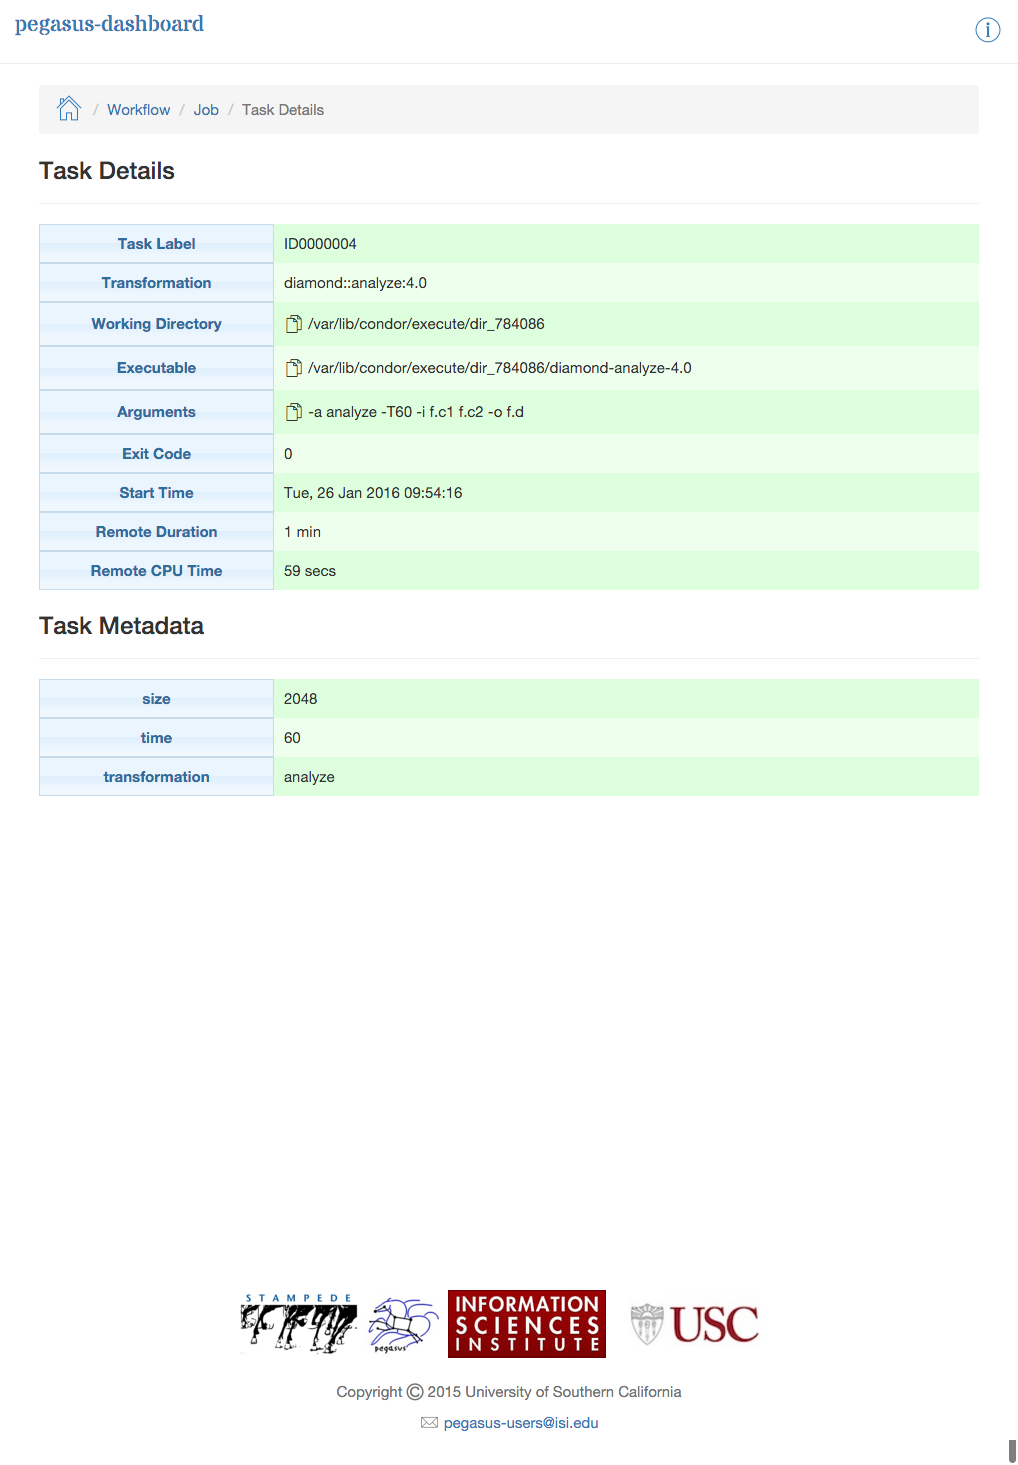
Dashboard Invocation Page
The dashboard also has web pages for workflow statistics and workflow charts, which graphically renders information provided by the pegasus-statistics and pegasus-plots command respectively.
The Statistics page shows the following statistics.
Workflow level statistics
Job breakdown statistics
Job specific statistics
Integrity statistics
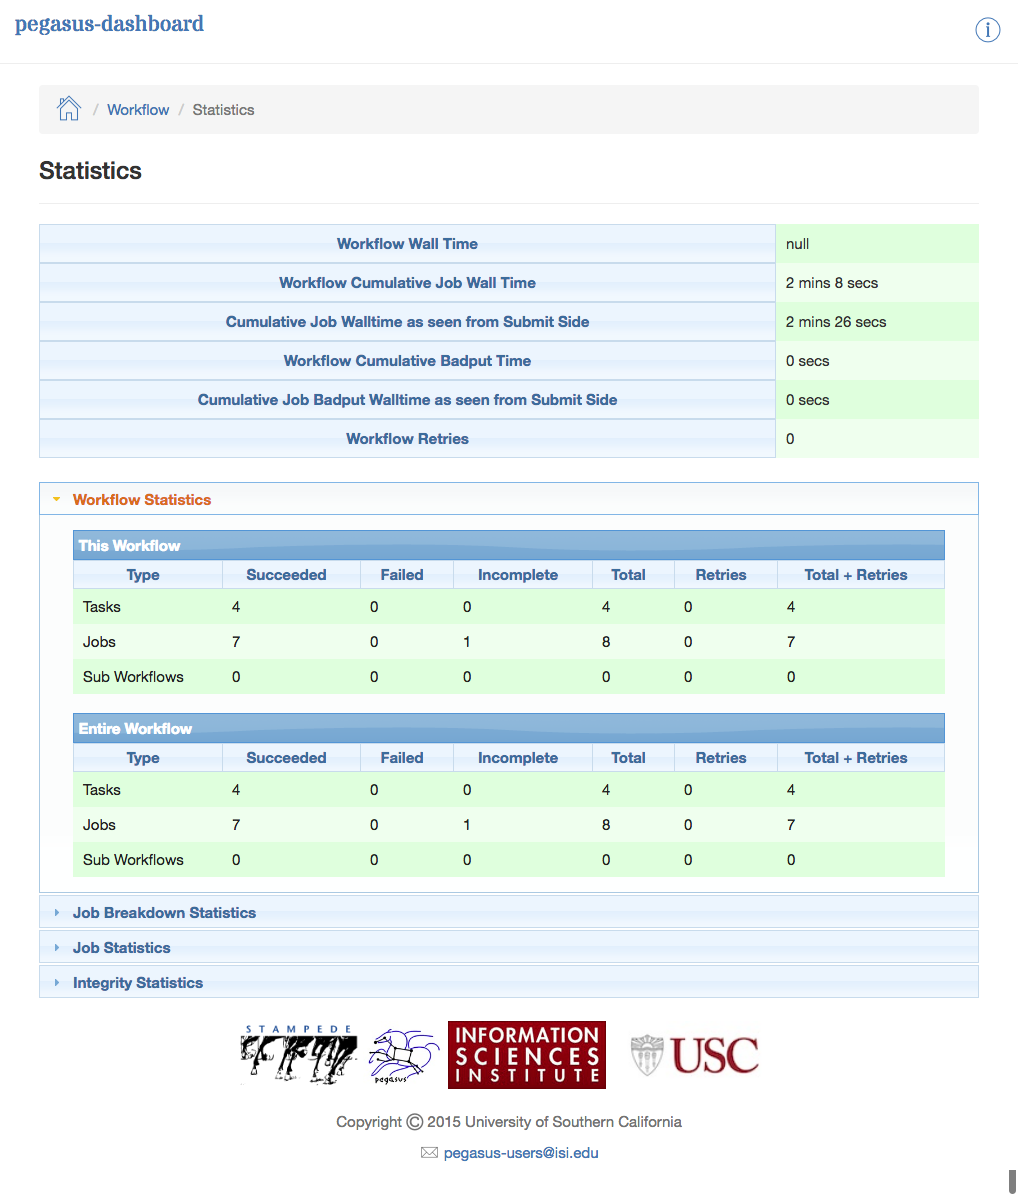
Dashboard Statistics Page
The Charts page shows the following charts.
Job Distribution by Count/Time
Time Chart by Job/Invocation
Workflow Execution Gantt Chart
The chart below shows the invocation distribution by count or time.
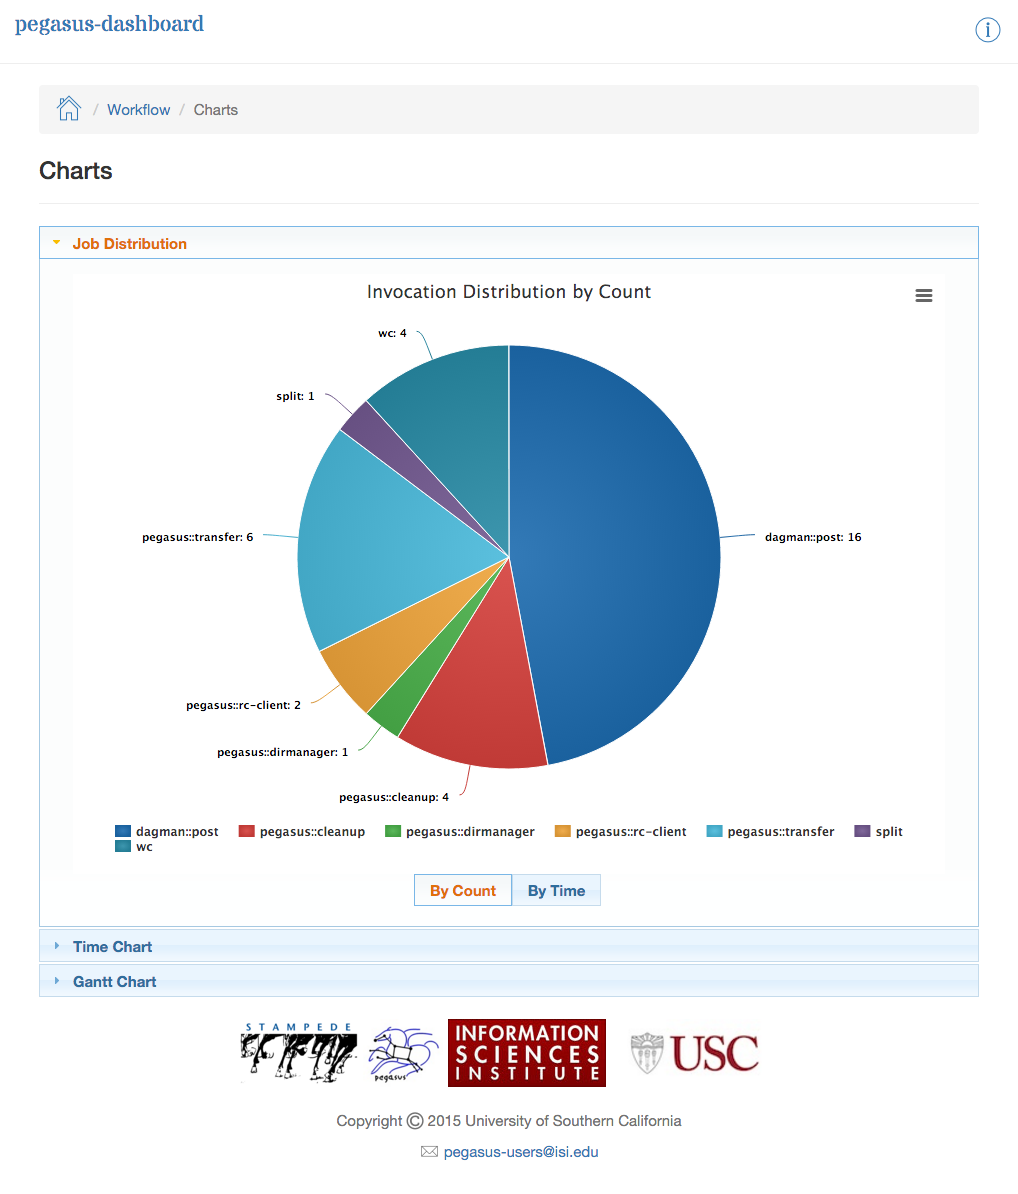
Dashboard Plots - Job Distribution
The time chart shown below shows the number of jobs/invocations in the workflow and their total runtime
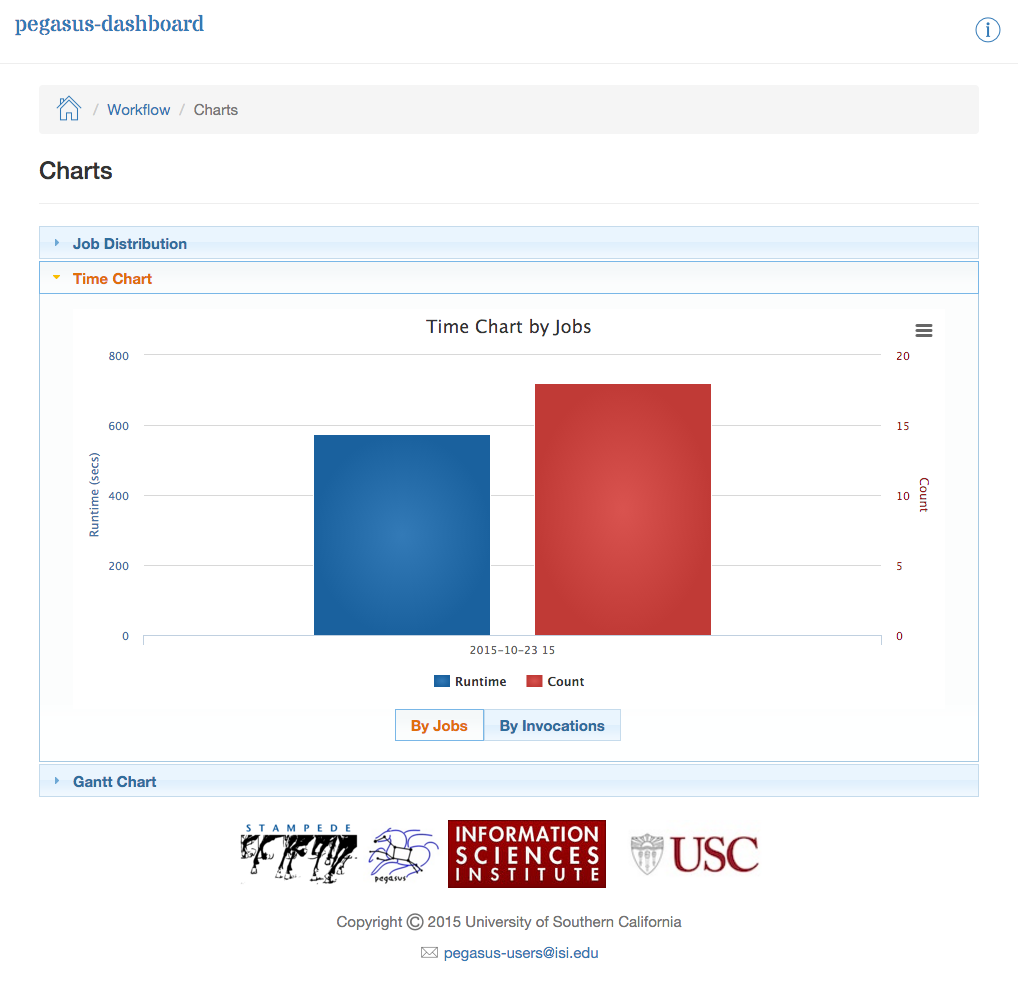
Dashboard Plots - Time Chart
The workflow gantt chart lays out the execution of the jobs in the workflow over time.
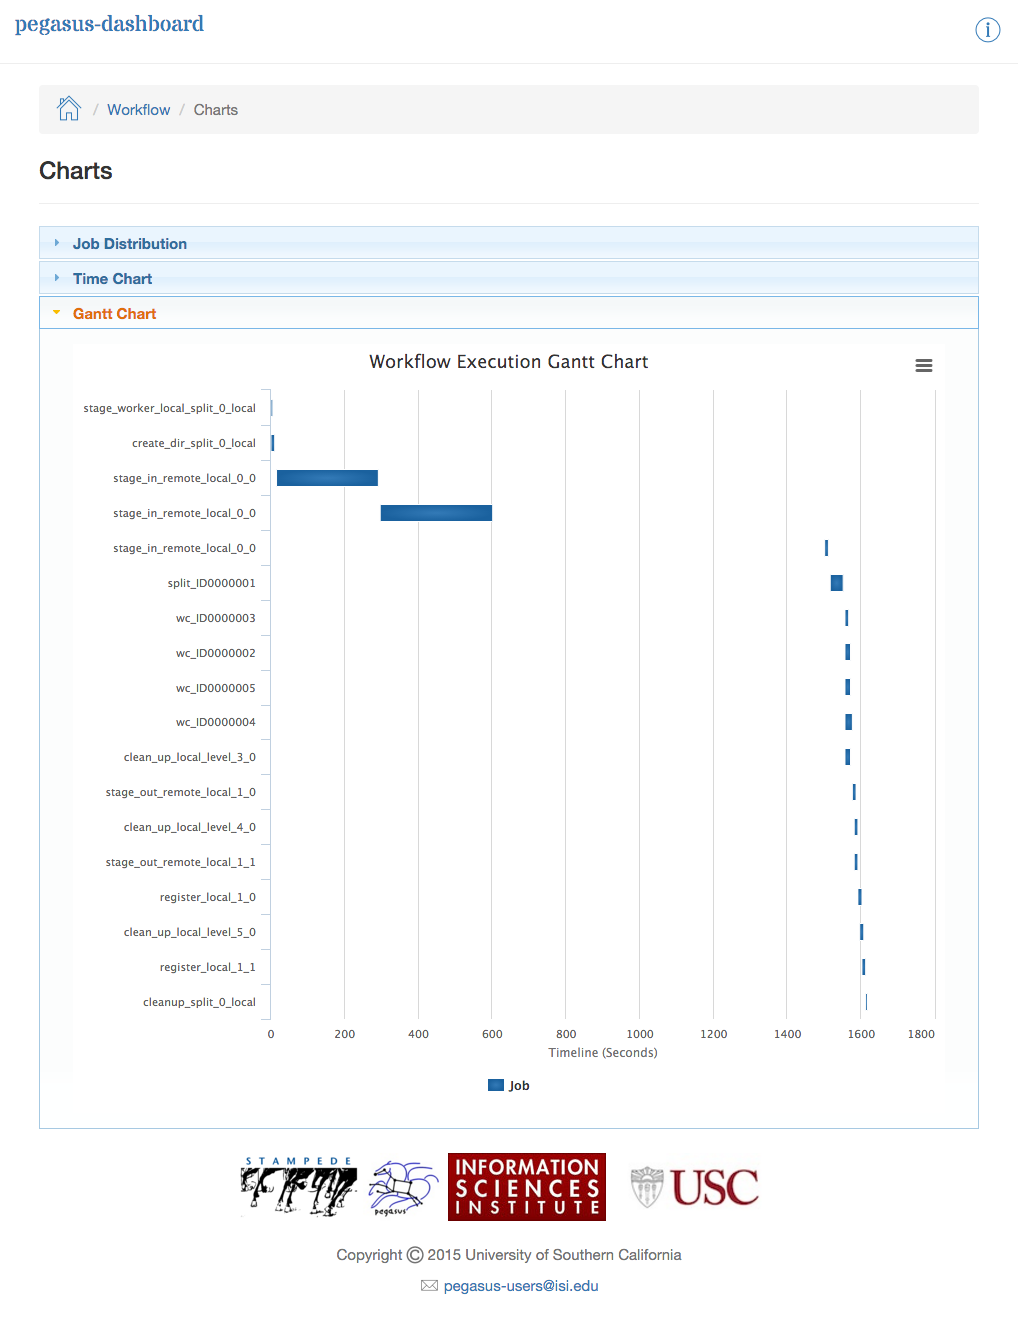
Dashboard Plots - Workflow Gantt Chart
9.4. Hooks
The Pegasus Workflow Mapper supports job and workflow level shell hooks (formerly called notifications). For each shell hook, the following must be given:
the event when the hook is to be executed
the executable that needs to be invoked as part of the hook
Hooks are executed from the submit host by the pegasus-monitord daemon that monitors the Condor logs for the workflow. When a hook is executed, pegasus-monitord sets certain environment variables that contain information about the job and workflow state.
The Pegasus release comes with an email notification client that can be used as a shell hook to send notifications as events occur.
Note
Prior to Pegasus5.0, Pegasus supported the notion of an Invoke or Notification. In Pegasus5.0, this has been renamed to Hooks as there are plans to support additional hooks beyond shell script/executable invocations. In the following sections, we use these terms interchangeably.
9.4.1. Specifying Hooks in the Workflow
You can specify shell hooks for the entire workflow, individual jobs (including subworkflows), and transformations (executables). This guide is written from the perspective of the Python API, however the following illustrates how shell hooks can also be added using the Java API.
wf = Workflow("diamond")
wf.add_shell_hook(EventType.START, "/pegasus/dist/pegasus-5.0.0dev/share/pegasus/notification/email --to email@school.edu")
wf.add_shell_hook(EventType.END, "echo 'the workflow has ended'")

j = Job("preprocess")
j.add_shell_hook(EventType.ERROR, "echo 'error'")
ADAG wf = new ADAG("diamond");
wf.addNotification(Invoke.WHEN.start, "/pegasus/dist/pegasus-5.0.0dev/share/pegasus/notification/email --to email@school.edu");
wf.addNotification(Invoke.WHEN.end, "echo done");

Job j1 = new Job("j1", "pegasus", "preprocess", "4.0");
j1.addNotification(Invoke.WHEN.error, "echo error");
Hooks may be specified multiple times, as needed. Each has a mandatory EventType (when) attribute with the following value set.
Enumeration of Values for when attribute |
Meaning |
|---|---|
NEVER |
(default). This is useful to temporarily disable an existing hooks. |
START |
when the job is submitted. |
ERROR |
after a job finishes with failure (exitcode != 0). |
SUCCESS |
after a job finishes with success (exitcode == 0). |
END |
after a job finishes, regardless of exitcode. |
ALL |
start and end combined. |
You can specify multiple hooks corresponding to the same attribute (workflow, job, subworkflow, transformation).
Here is an example that illustrates that.
wf = Workflow("diamond")
wf.add_shell_hook(EventType.START, "echo hello1")
wf.add_shell_hook(EventType.START, "echo hello2")
In the above example, the executable echo will be invoked twice when
the workflow starts, once with the argument, hello1, and a second time
with the argument hello2.
See HookMixin for API usage documentation.
9.4.2. Notify File created by Pegasus in the submit directory
Pegasus, while planning a workflow writes out a notify file in the submit directory that contains all the hooks that need to be handled for the workflow. pegasus-monitord picks up this notifications file to determine what hooks need to be handled and when.
ENTITY_TYPE ID NOTIFICATION_CONDITION ACTION
ENTITY_TYPE can be either of the following keywords
WORKFLOW - indicates workflow level notification
JOB - indicates notifications for a job in the executable workflow
DAXJOB - indicates notifications for a DAX Job in the executable workflow
DAGJOB - indicates notifications for a DAG Job in the executable workflow
ID indicates the identifier for the entity. It has different meaning depending on the entity type - -
workflow - ID is wf_uuid
JOB|DAXJOB|DAGJOB - ID is the job identifier in the executable workflow ( DAG ).
NOTIFICATION_CONDITION is the condition when the notification needs to be sent (e.g. start, success, error, etc.).
ACTION is what needs to happen when condition is satisfied. It is executable + arguments
INVOCATION JOB_IDENTIFIER INV.ID NOTIFICATION_CONDITION ACTION
The INVOCATION lines are only generated for clustered jobs, to specifiy the finer grained notifications for each constitutent job/invocation .
JOB IDENTIFIER is the job identifier in the executable workflow ( DAG ).
INV.ID indicates the index of the task in the clustered job for which the notification needs to be sent.
NOTIFICATION_CONDITION is the condition when the notification needs to be sent (e.g. start, success, error, etc.).
ACTION is what needs to happen when condition is satisfied. It is executable + arguments
A sample notifications file generated is listed below.
WORKFLOW d2c4f79c-8d5b-4577-8c46-5031f4d704e8 on_error /bin/date1

INVOCATION merge_vahi-preprocess-1.0_PID1_ID1 1 on_success /bin/date_executable
INVOCATION merge_vahi-preprocess-1.0_PID1_ID1 1 on_success /bin/date_executable
INVOCATION merge_vahi-preprocess-1.0_PID1_ID1 1 on_error /bin/date_executable

INVOCATION merge_vahi-preprocess-1.0_PID1_ID1 2 on_success /bin/date_executable
INVOCATION merge_vahi-preprocess-1.0_PID1_ID1 2 on_error /bin/date_executable

DAXJOB subdax_black_ID000003 on_error /bin/date13
JOB    analyze_ID00004    on_success /bin/date
9.4.3. Configuring pegasus-monitord for hooks
Whenever pegasus-monitord enters a workflow (or sub-workflow) directory, it will read the notifications file generated by Pegasus. Pegasus-monitord will match events in the running workflow against the hooks specified in the notifications file and will initiate the script specified in a hook when that hook matches an event in the workflow. It is important to note that there will be a delay between a certain event happening in the workflow, and pegasus-monitord processing the log file and executing the corresponding hook.
The following command line options (and properties) can change how pegasus-monitord handles hooks:
--no-notifications(pegasus.monitord.notifications=False): Will disable hooks completely.--notifications-max=nn(pegasus.monitord.notifications.max=nn): Will limit the number of concurrent hooks to nn. Once pegasus-monitord reaches this number, it will wait until one hook finishes before starting a new one. Hooks happening during this time will be queued by the system. The default number of concurrent hooks for pegasus-monitord is 10.--notifications-timeout=nn(pegasus.monitord.notifications.timeout=nn): This setting is used to change how long will pegasus-monitord wait for a hook to finish. By default pegasus-monitord will wait for as long as it takes (possibly indefinitely) until a hook ends. With this option, pegasus-monitord will wait for at most nn seconds before killing the hook.
It is also important to understand that pegasus-monitord will not issue any hook when it is executed in replay mode.
9.4.3.1. Environment set for the notification scripts
Whenever a notification in the notifications file matches an event in the running workflow, pegasus-monitord will run the corresponding script specified in the ACTION field of the notifications file. Pegasus-monitord will set the following environment variables for each notification script is starts:
PEGASUS_EVENT: The NOTIFICATION_CONDITION that caused the notification. In the case of the “all” condition, pegasus-monitord will substitute it for the actual event that caused the match (e.g. “start” or “at_end”).PEGASUS_EVENT_TIMESTAMP: Timestamp in EPOCH format for the event (better for automated processing).PEGASUS_EVENT_TIMESTAMP_ISO: Same as above, but in ISO format (better for human readability).PEGASUS_SUBMIT_DIR: The submit directory for the workflow (usually the value from “submit_dir” in the braindump.txt file)PEGASUS_STDOUT: For workflow notifications, this will correspond to the dagman.out file for that workflow. For job and invocation notifications, this field will contain the output file (stdout) for that particular job instance.PEGASUS_STDERR: For job and invocation notifications, this field will contain the error file (stderr) for the particular executable job instance. This field does not exist in case of workflow notifications.PEGASUS_WFID: Contains the workflow id for this notification in the form of DAX_LABEL + DAX_INDEX (from thebraindump.ymlfile).PEGASUS_JOBID: For workflow notifications, this contains the worfkflow wf_uuid (from thebraindump.ymlfile). For job and invocation notifications, this field contains the job identifier in the executable workflow ( DAG ) for the particular notification.PEGASUS_INVID: Contains the index of the task in the clustered job for the notification.PEGASUS_STATUS: For workflow notifications, this contains DAGMan’s exit code. For job and invocation notifications, this field contains the exit code for the particular job/task. Please note that this field is not present for ‘start’ notification events.
9.4.4. Default Notification Scripts
Pegasus ships with a reference notification script that can be used as a shell hook. This can be used as a starting point when creating your own notification script, or if the default one is all you need, you can use it directly in your workflows.
share/pegasus/notification/email - sends email, including the output from
pegasus-status(default) orpegasus-analyzer.$ ./share/pegasus/notification/email --help Usage: email [options] Options: -h, --help show this help message and exit -t TO_ADDRESS, --to=TO_ADDRESS The To: email address. Defines the recipient for the notification. -f FROM_ADDRESS, --from=FROM_ADDRESS The From: email address. Defaults to the required To: address. -r REPORT, --report=REPORT Include workflow report. Valid values are: none pegasus-analyzer pegasus-status (default)
This can be used as follows:
wf.add_shell_hook(EventType.START, "/pegasus/dist/pegasus-5.0.0dev/share/pegasus/notification/email --to email@school.edu")