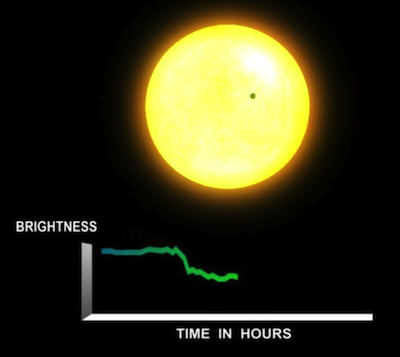
The periodogram application processes time-series data collected by NASA’s Kepler mission. The Kepler satellite uses high-precision photometry to search for exoplanets transiting their host stars. In 2009 the Kepler mission began a multi-year transit survey of 170,000 stars near the constellation Cygnus. In 2010 the project released a data set containing 210,664 light curves, which record how the brightness of a star changes over time. Analyzing light curves to identify the periodic dips in brightness that arise from transiting exoplanets requires the calculation of periodograms, which reveal periodic signals in time-series data and estimate their significance. Generating periodograms is a computationally intensive process that requires high-performance, distributed computing.
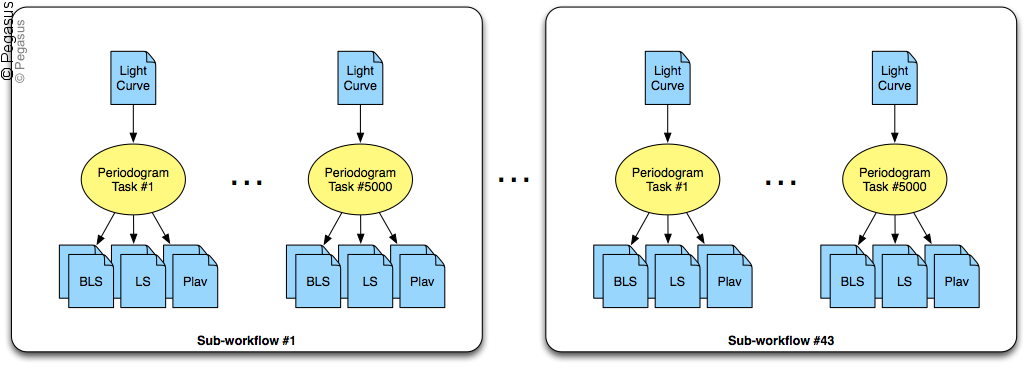
In order to support the analysis of Kepler’s 210,664 light curve dataset we developed a workflow using Pegasus. The workflow, illustrated by the figure below, consists of 43 sub-workflows, each of which contains approximately 5,000 tasks. Each task applies three different periodogram algorithms to an input light curve to produce three pairs of output files. Using estimates for the runtimes of the tasks, Pegasus uses runtime clustering to group the tasks in these workflows into 2,354 60-minute jobs that can be efficiently submitted to the target infrastructures. The workflow requires approximately 66 days of sequential computation, consumes 17 GB of input data, and produces 105 GB of output data in 1.2 million output files.
Scientists: Bruce Berriman, Peter Plavchan (IPAC)