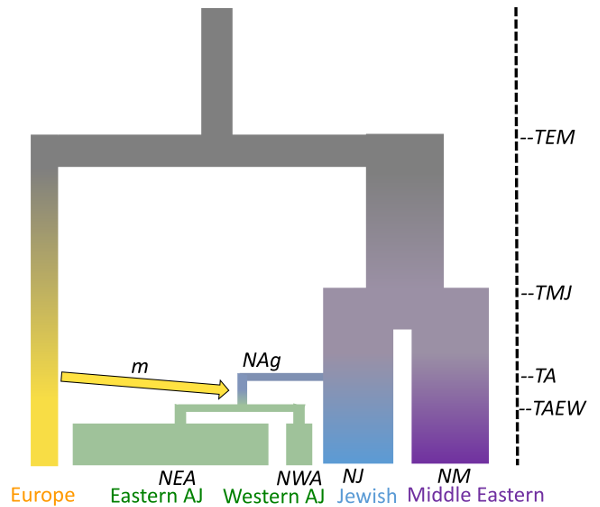
Ariella Gladstein at the University of Arizona reconstructed the population history of Ashkenazi Jews, who are Jews historically from Central and Eastern Europe. The Ashkenazi Jews are often used in genetic studies due to their high rates of genetic disorders and complicated population history. However, until now, genetic studies have regarded the Ashkenazi Jews as one population. For the first time, Gladstein found that Ashkenazi Jews from Central and Eastern Europe are genetically distinct and likely diverged in the recent past due to differences in population growth rates (higher in Eastern Europe). These genetic results are in agreement with historical estimates of census population growth of Ashkenazi Jews in Central and Eastern Europe. This work was part of Gladstein’s PhD. thesis. She is now a postdoctoral researcher with Daniel Schrider at the University of North Carolina, Chapel Hill (https://www.schriderlab.org/)
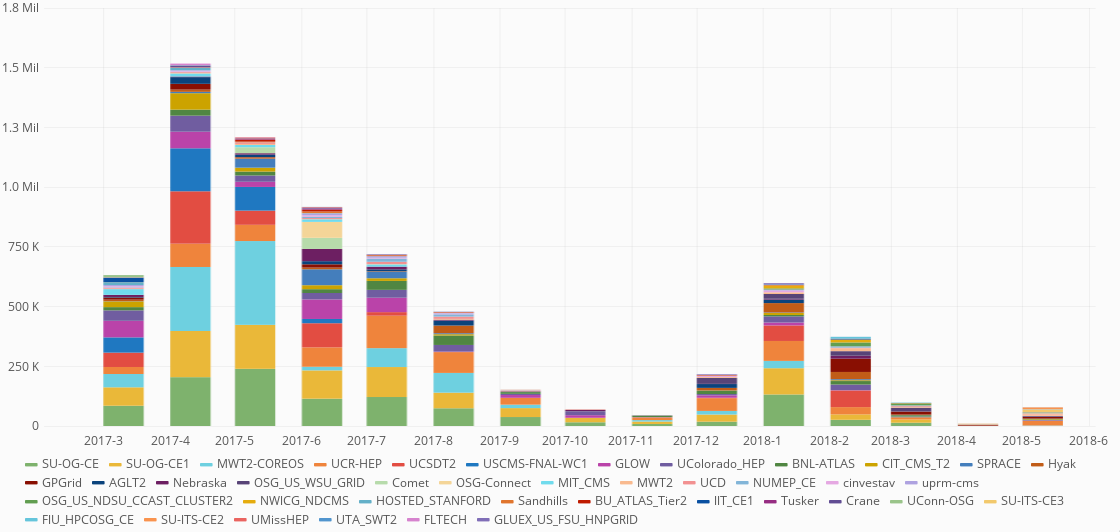
Pegasus WMS enabled the automation of running the genome simulations necessary for the analysis. Pegasus managed about 3 million tasks, using more than 7 million CPU hours on the Open Science Grid via the OSGConnect services.
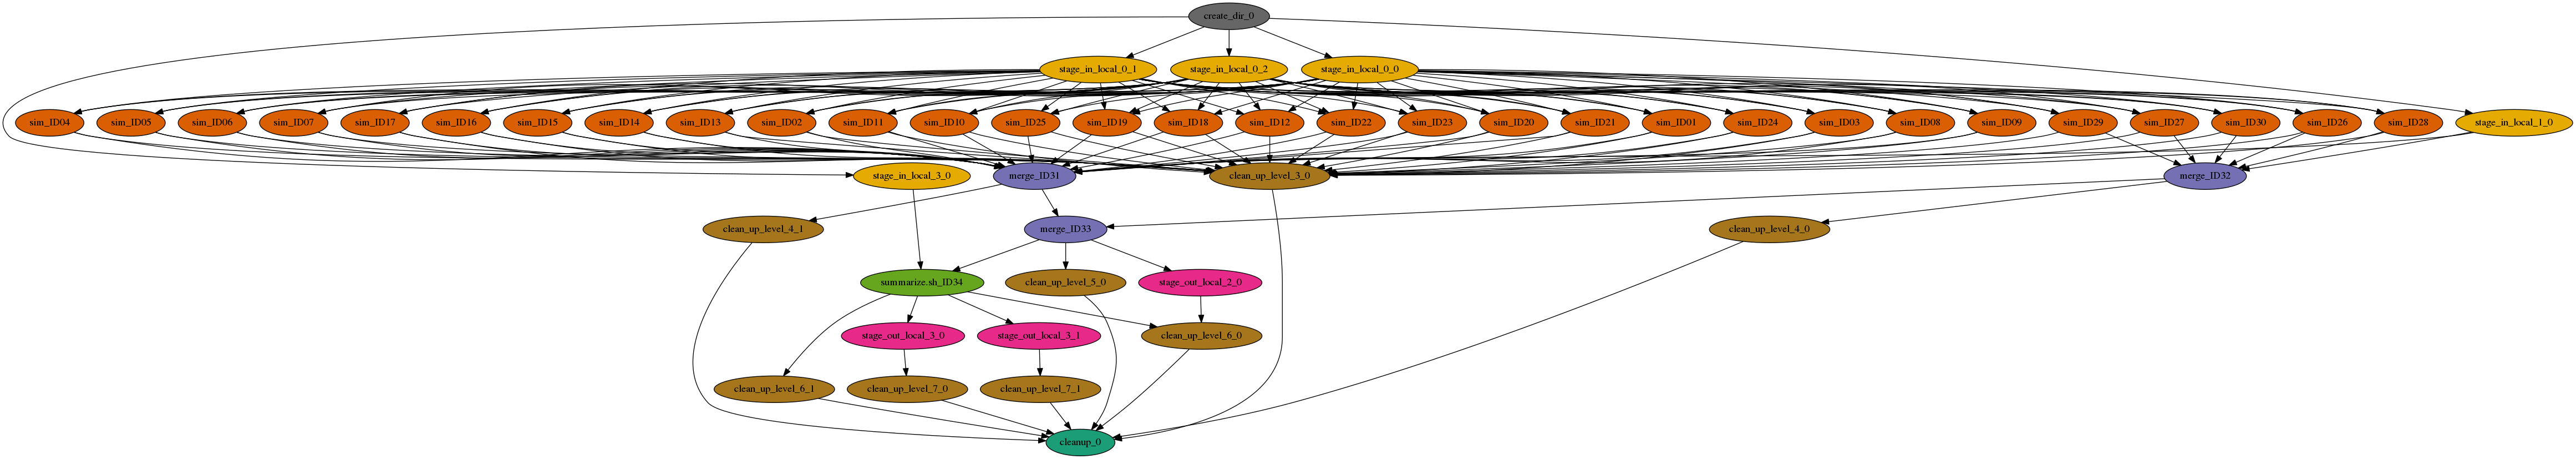
The workflow is a large set of independent simulations (hundreds of thousands to millions), followed by a set of merge and data summarize tasks. First, a large number of independent simulations are run for each demographic model, then genomic summary statistics are calculated using the simulated genomes and real data, and finally the model and parameters that give the closest statistics to the real data are identified. The Pegasus workflow completes the first two steps, and the final step is done separately.
In order to make this type of analysis more accessible to other population genetics researchers, Gladstein and a number of other University of Arizona graduate students, undergrads, and CyVerse staff, created a generalized program, SimPrily, to simulate any historical model on the Open Science Grid. Researchers with minimal computational experience can now run large scale genomic simulations on the Open Science Grid. Check out SimPrily at https://agladstein.github.io/SimPrily/
Resulting Publications:
- Ariella L Gladstein, Michael F Hammer; Substructured population growth in the Ashkenazi Jews inferred with Approximate Bayesian Computation, Molecular Biology and Evolution, msz047, https://doi.org/10.1093/molbev/msz047
- Gladstein A.L, Hammer M.F. Substructured population growth in the Ashkenazi Jews inferred with Approximate Bayesian Computation. bioRxiv 467761; doi: https://doi.org/10.1101/467761
- Gladstein, A.L., Quinto-Cortés, C.D., Pistorius, J.L., Christy, D., Gantner, L., Joyce, B.L. (2018). SimPrily: A Python framework to simplify high-throughput genomic simulations. SoftwareX, 7:335-340. https://doi.org/10.1016/j.softx.2018.09.003
5,256 views