Authors: Eric Lyons (University of Massachusetts at Amherst), Dong-Jun Seo (University of Texas Arlington), Sunghee Kim (University of Texas Arlington), Hamideh Habibi (University of Texas Arlington), George Papadimitriou (USC – Information Sciences Institute), Ryan Tanaka (USC – Information Sciences Institute)
Research Distributed Hydrologic Model
A collaborative effort of several National Oceanic and Atmospheric Administration (NOAA) and National Weather Service (NWS) hydrology research laboratories, the Research Distributed Hydrologic Model (RDHM) (Koren et al. 2004, Reed et al. 2007), was developed to improve streamflow predictions in streams and rivers and to improve flash flood forecasting by incorporating evolving estimates of relevant parameters, such as soil moisture, soil temperature, permeability, and vegetation, in addition to the primary forcing mechanism, rainfall. Since its inception in 2008, local domain knowledge has improved. For example, in the Dallas-Fort Worth (DFW) metroplex in North Texas, high resolution Lidar based surveys have enabled the creation of highly accurate topology mappings which expose riverbeds and manmade drainage systems. Additionally, urban surface changes have been well documented thanks to such mappings. This knowledge has also contributed to an improvement in the accuracy of gridded rainfall estimates, which are provided at higher temporal and spatial resolutions. The RDHM model has traditionally been run on a single, powerful dedicated server. In an effort to improve scalability as resolutions and domain sizes increase, and to tailor the output for stakeholder decision support, here we have containerized the model for use in the cloud, and adopted Pegasus to manage the workflow.
RDHM Workflow
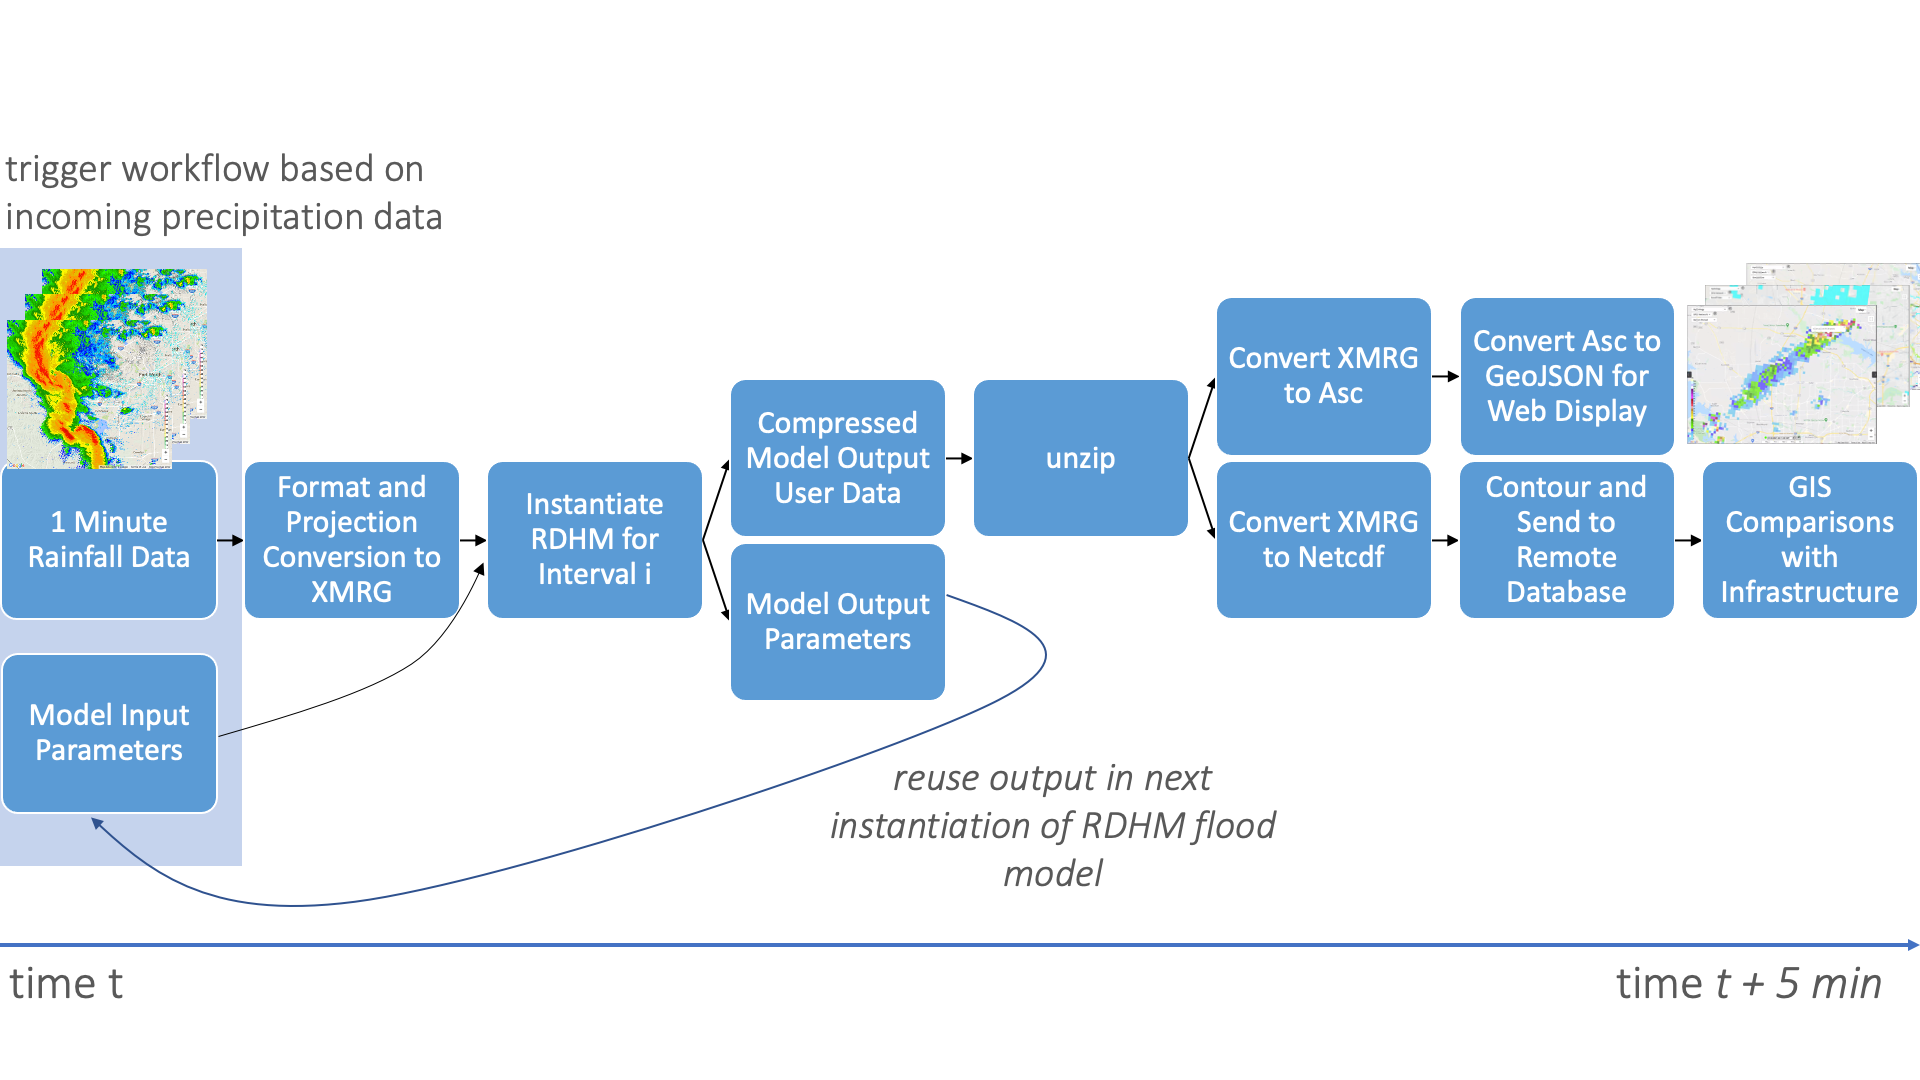
Figure 1: RDHM Pegasus Workflow
The RDHM workflow (depicted in figure 1) was developed using the Pegasus 5.0 Python API and is executed in an ExoGENI deployment by Pegasus on a continual basis using the latest precipitation data provided by two sources: the Next Generation Weather Radar (NEXRAD) system and a network of Doppler radars operated by the Collaborative Adaptive Sensing of the Atmosphere (CASA) partnership. This data is then combined and fed into the RDHM flood model, along with a multitude of input parameters derived from high-resolution topography, land cover, land use, and soil data of the DFW region, and other hydrologic and climatological data. To ensure that the RDHM flood model has access to best estimates of the current hydrologic conditions, its output from the previous run of the workflow is also passed in as an input, forming a feedback loop over all consecutive runs of this workflow. Once complete, the RDHM model outputs streamflow, runoff, and return period estimates valuable for flash flood forecasting, along with the updated parameterizations to be used for the next instantiation of the model. This output data is formatted as XMRG, a legacy binary format in the Hydrological Rainfall Analysis Projection (HRAP) coordinate system, used by the NWS. The next steps in this workflow involve converting the XMRG output file(s) into the modern GIS format GeoJSON, and the packed binary grid format NetCDF, with standard WGS84 map projections. The output GeoJSON files can be ingested by mapping services such as Google maps for web display (figures 2, 3, 4), while the NetCDF files are contoured into geofenced polygons representing areas where the hydrologic values exceed standard thresholds for alerting. These contours are sent to a remote database in near real time, triggering targeted flash flood alerts sent to people in the risk area, as well as city emergency managers and stormwater management personnel.
To ensure portability across various clouds, this workflow utilizes Pegasus’ Singularity container support. The RDHM model and all the downstream processes are containerized with the latest model parameters stored locally for continuity across runs and also to persist offline should the compute cloud architecture go down.
Visualizing RDHM Data
As GeoJSON files are generated from each workflow run on a minute by minute basis, they can be made available for viewing on the web. Streamflow, return period, and runoff rates are some of the features which can be visualized and interacted with on the map.
Figure 2: RDHM generated streamflow
Streamflow. Utilizing the rainfall data provided by the radar systems and layers of hydrologic parameters, the RDHM model can simulate stream flows. This is illustrated in figure 2 where the colored lines represent stream flows through river basins. Typically, as seen on the lower right portion, the streams flow within narrow, well defined channels. But in the case of floods, as in the center of the image, the streams exceed its banks and can flow over much larger areas.
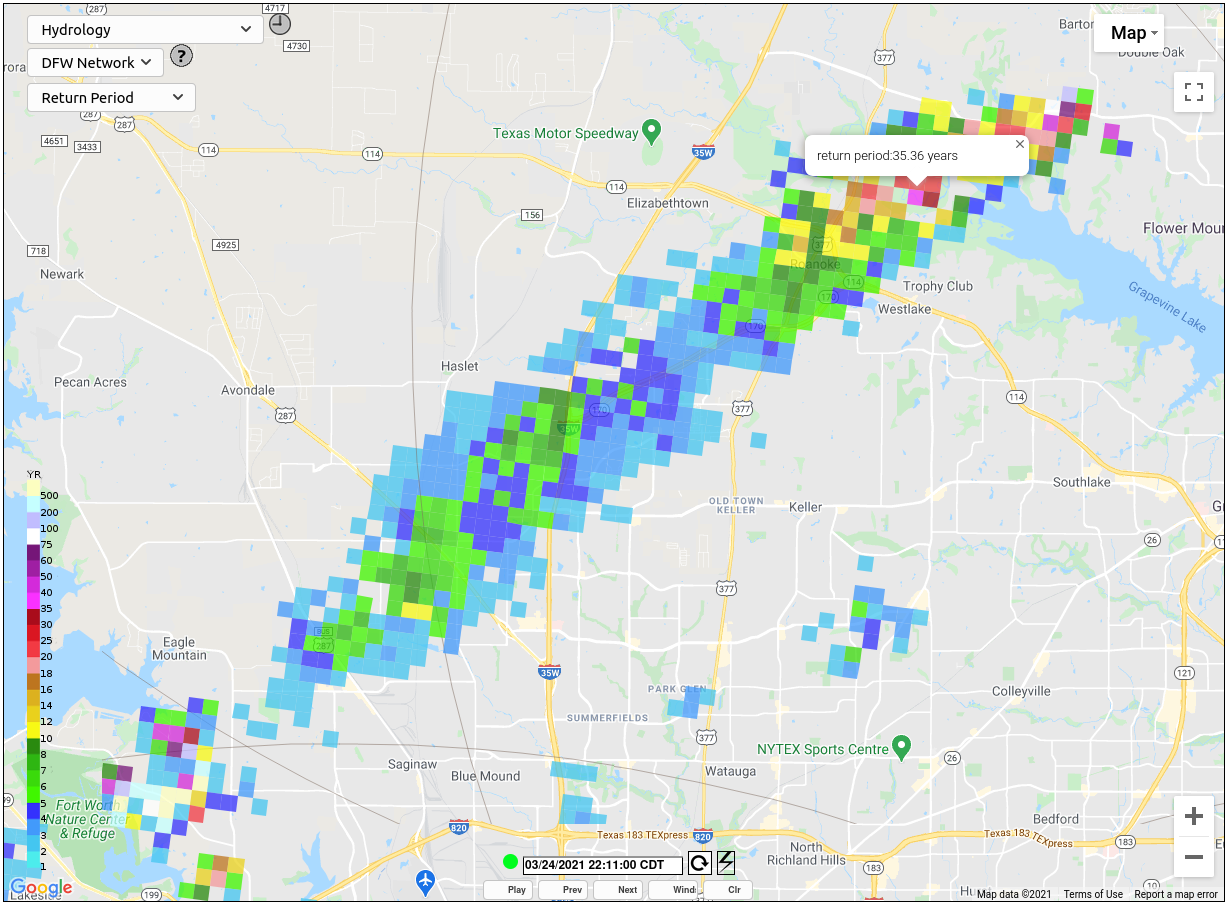
Figure 3: RDHM generated flooding return period
Flooding Return Period. Return period is the time interval that you would expect a flood of some size to occur on average at a given location. The colored regions in figure 3 show the estimated return period of flooding in the area, and based on these areas automated alerts can be sent to stormwater managers and other key actors.
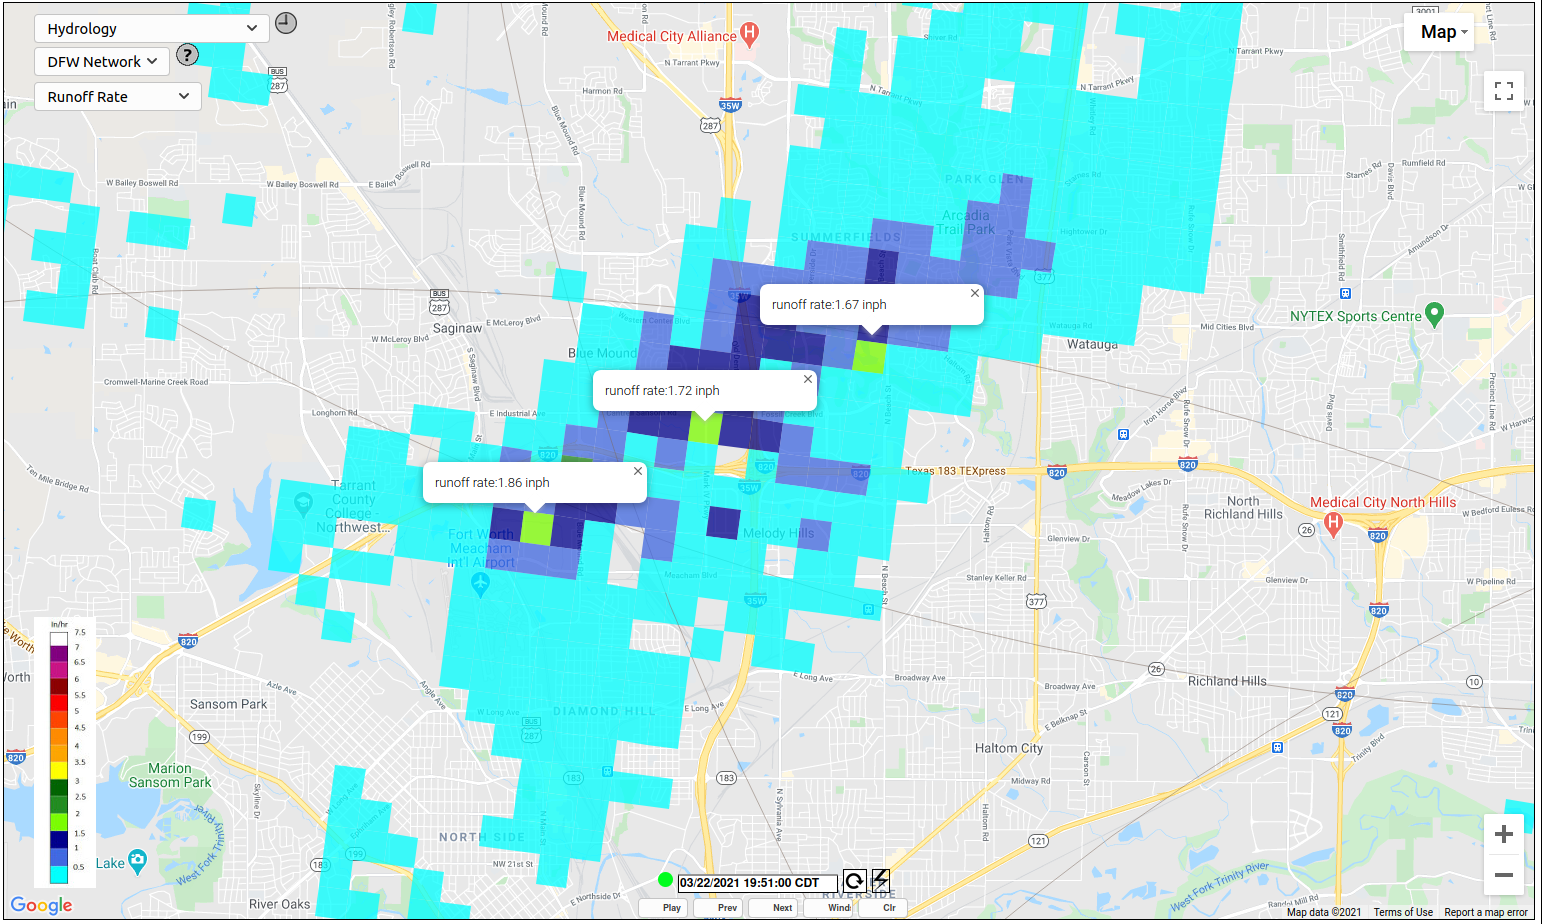
Figure 4: RDHM generated runoff rate
Runoff rate. Depending on how wet or dry the soil conditions are, a certain amount of rainfall infiltrates into the ground. Runoff rate is the rainfall rate subtracted by the infiltration rate. When the soil is saturated, runoff rate is as high as rainfall rate itself which is more likely to produce flooding than in dryer soil conditions. This is depicted in figure 4.
Community Impact
The automated execution of the RDHM pipeline in the cloud using Pegasus is displayed live to over 1000 emergency managers, first responders, and stormwater managers in the DFW metroplex, providing visual clues and mobile app alerts when observed values suggest that flash flooding is occurring over customizable regions of interest. EMs and safety officials can then use the app to make notes or even take pictures of the affected areas and automatically distribute to app holders located in the region, as shown in figure 5. Additionally, experiments are ongoing to use streamflow variations from RDHM as a trigger to perform water quality sampling by Environmental Health and Safety (EHS) personnel at DFW International Airport to ensure pollutants are not being dispersed into the watersheds. While the current implementation of this workflow is for the North Texas region only, proposals have been submitted to expand its use to the Connecticut River Valley in MA and beyond.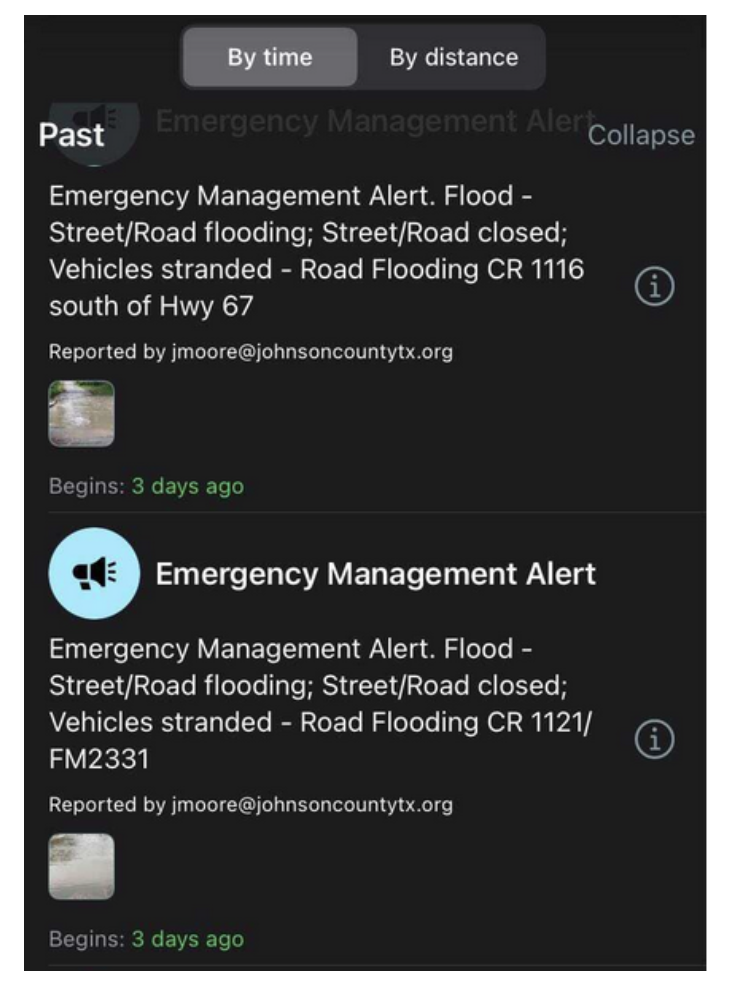
Figure 5: CASA Alerts app where RDHM alerts are issued and Public Safety officials can provide confirmation and augment with information, images, and videos.
Acknowledgements: Work on the RDHM workflow is supported by the National Science Foundation through DyNamo (Award # 1826997) and FlyNet (Award # 2018074).
References
Koren, V., S. Reed, M. Smith, Z. Zhang, and D.-J. Seo, 2004. Hydrology laboratory research modeling system (HL-RMS) of the US national weather service. Journal of Hydrology, 291(3-4), 297-318.
Reed, S., J. Schaake, and Z. Zhang, 2007. “A distributed hydrologic model and threshold frequency-based method for flash flood forecasting at ungauged locations”, J. Hydrology, 337, 402–420.